The objective of ggrefine is to provide complete themes and functions for publication-quality ‘ggplot2’ visualisation.
Installation
Install from CRAN, or development version from GitHub.
install.packages("ggrefine")
pak::pak("davidhodge931/ggrefine")
Theme
The themes are built to work with the refine functions in that they have all axis and panel grid elements.
They can also be customised easily.
The theme_ggplot2 function has a smart panel_grid_colour default that is derived from the panel_background_fill.
library(ggplot2)
library(ggrefine)

set_theme(theme_lights())
update_panel_size(heights = unit(5, "cm"), widths = unit(7.5, "cm"))

p <- mpg |>
  ggplot() +
  aes(x = hwy) +
  geom_histogram(
    stat = "bin",
  ) +
  scale_y_zero() +
  scale_colour_blend_discrete() +
  refine_axis_grid(discrete = "none")

p + labs(title = "theme_lights")
#> `stat_bin()` using `bins = 30`. Pick better value `binwidth`.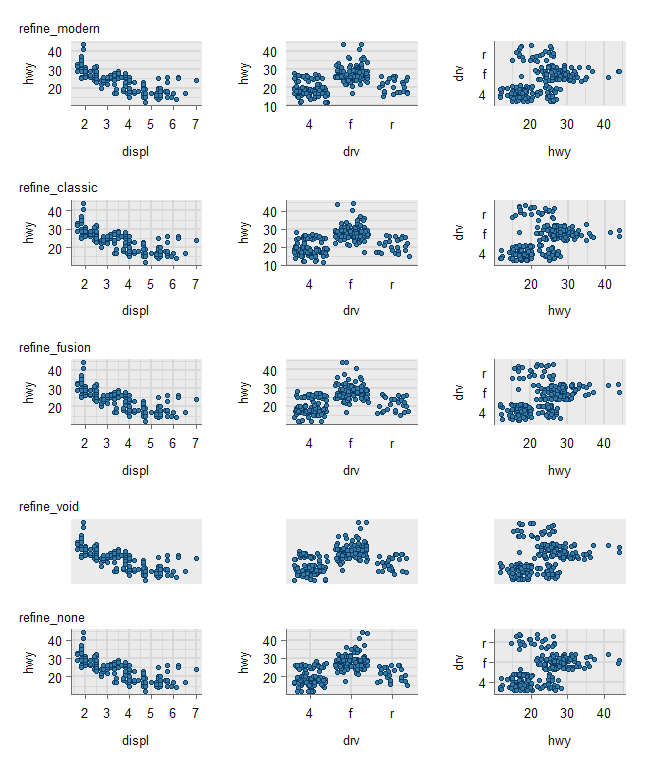
update_greys()
p + labs(title = "theme_greys")
#> `stat_bin()` using `bins = 30`. Pick better value `binwidth`.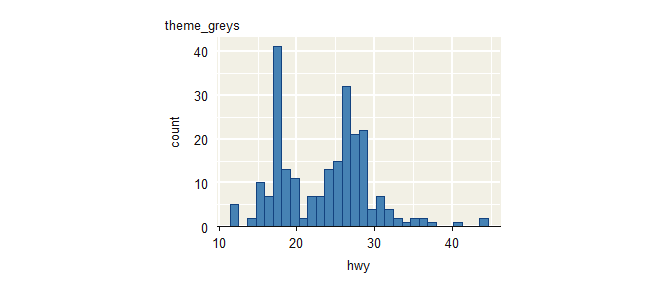
update_darks()
p + labs(title = "theme_darks")
#> `stat_bin()` using `bins = 30`. Pick better value `binwidth`.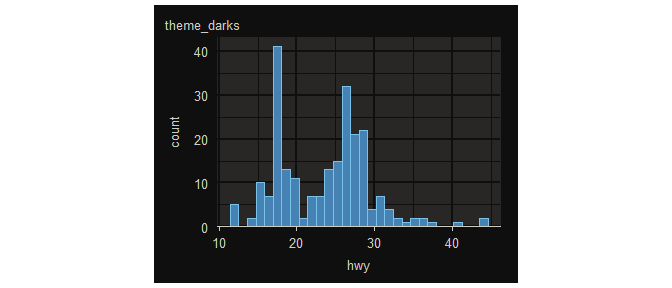
Scales and Aesthetics
The package provides dynamic color and fill aesthetic and scale helpers that evaluate aesthetics late to provide automatic colour or fill properties.
These can be:
- a blend of fill (or colour)
- a contrast of fill (intended for text geoms)
- a contrast of the panel.background fill (intended for text geoms).
Note aes_colour_contrast requires the ggrefine function to be used instead of ggplot2::ggplot to work where no fill aesthetic is mapped. As such, it can be useful to always use ggrefine followed by ggplot2::aes to avoid thinking about this.
penguins |>
  ggrefine() +
  aes(x = flipper_len, y = body_mass, fill = I(jumble::pink)) +
  geom_point() +
  scale_colour_blend_discrete() +
  refine_axis_grid(discrete = "none")
#> Warning: Removed 2 rows containing missing values or values outside the scale range
#> (`geom_point()`).
penguins |>
  ggrefine() +
  aes(x = flipper_len, y = body_mass) +
  geom_point(aes_colour_blend()) +
  geom_path() +
  refine_axis_grid(discrete = "none")
#> Warning: Removed 2 rows containing missing values or values outside the scale range
#> (`geom_point()`).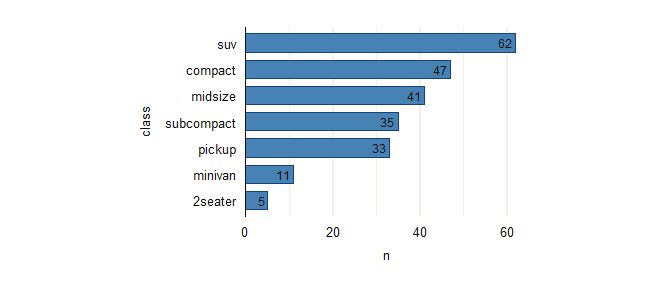
penguins |>
  ggrefine() +
  aes(x = flipper_len, y = body_mass, fill = species) +
  geom_point() +
  scale_colour_blend_discrete() +
  refine_axis_grid(discrete = "none")
#> Warning: Removed 2 rows containing missing values or values outside the scale range
#> (`geom_point()`).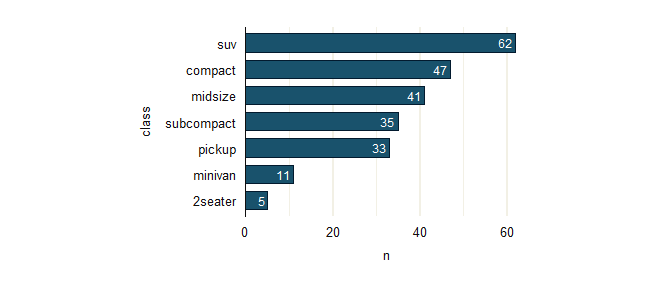
penguins |>
  ggrefine() +
  aes(
    x = flipper_len,
    y = body_mass,
  ) +
  geom_point(aes_colour_blend()) +
  geom_path() +
  refine_axis_grid(discrete = "none")
#> Warning: Removed 2 rows containing missing values or values outside the scale range
#> (`geom_point()`).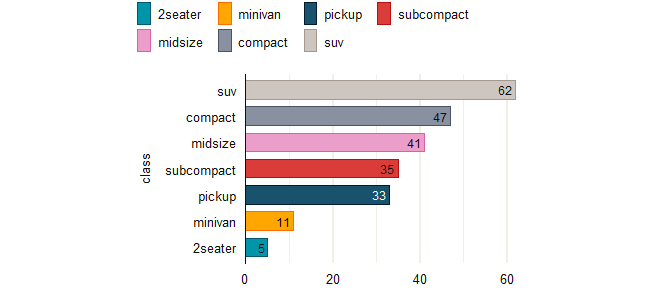
p <- mpg |>
  dplyr::count(class) |>
  dplyr::mutate(class = forcats::fct_reorder(class, n)) |>
  ggrefine() +
  aes(x = n, y = class, label = n) +
  geom_col(width = 0.7) +
  scale_x_zero() +
  scale_colour_blend_discrete() +
  refine_axis_grid(discrete = "y")

p +
  geom_text(aes_colour_contrast(), hjust = 1.25)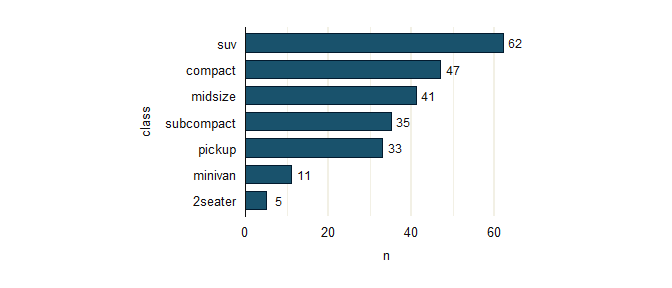
update_palette(fixed = jumble::navy)

p +
geom_text(aes_colour_contrast(), hjust = 1.25) 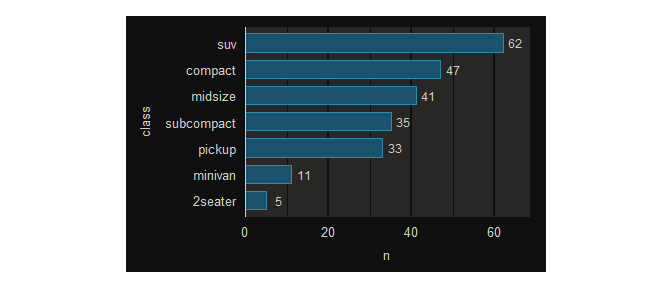
update_palette(discrete = jumble::jumble)

p +
  aes(fill = class) +
  geom_text(aes_colour_contrast(), hjust = 1.25) +
refine_legend(position = "top") 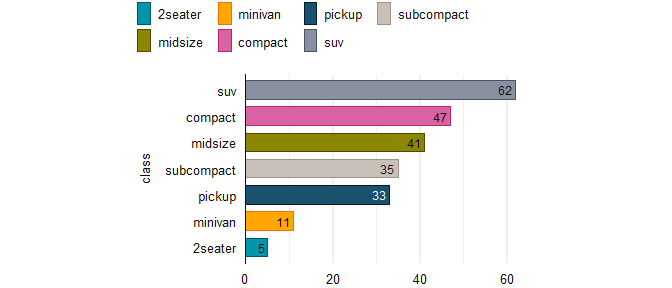
p +
  geom_text(aes(x = n + (max(n) * 0.05), !!!aes_colour_panel()))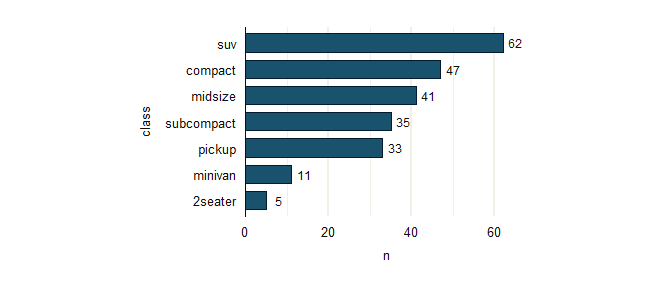
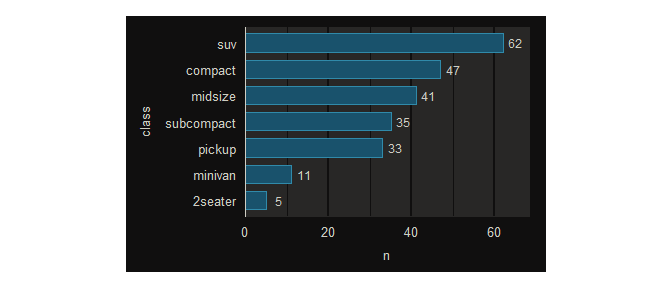
update_darks()

p +
  geom_text(aes(x = n + (max(n) * 0.05), !!!aes_colour_panel()))