Create a symmetric continuous x scale for ggplot2 plots.
The scale ensures that limits set to the range of breaks with zero expand (where symmetric = TRUE).
Note this scale should only be used in plots with geoms with stat = "identity".
Usage
scale_x_symmetric(
  data = NULL,
  x = NULL,
  ...,
  breaks = NULL,
  breaks_n = 6,
  expand = NULL,
  expand_limits = NULL,
  labels = NULL,
  position = "bottom",
  sec_axis = ggplot2::waiver(),
  transform = "identity",
  symmetric = TRUE
)
Arguments
- data
A data frame or tibble.
- x
An unquoted variable.
- ...
Provided to force user argument naming etc.
- breaks
A
scales::breaks_*function (e.g.scales::breaks_*()), or a vector of breaks.- breaks_n
If
breaks = NULL, the desired number of breaks.- expand
Padding to the limits with the
ggplot2::expansion()function, or a vector of length 2 (e.g.c(0, 0)).- expand_limits
Any values that the limits should encompass (e.g.
0).- labels
A function that takes the breaks as inputs (e.g.
\(x) stringr::str_to_sentence(x)orscales::label_*()), or a vector of labels.- position
The position of the axis (i.e.
"left","right","bottom"or"top").- sec_axis
A secondary axis created with
ggplot2::sec_axis()orggplot2::dup_axis().- transform
A transformation object (e.g.
scales::transform_log10()) or character string of this minus thetransform_prefix (e.g."log10").- symmetric
TRUEorFALSEof whether a symmetric scale.
Examples
library(ggplot2)
library(dplyr)
library(palmerpenguins)
set_blanket()
#> Warning: Duplicated aesthetics after name standardisation: fill
#> Warning: Duplicated aesthetics after name standardisation: fill
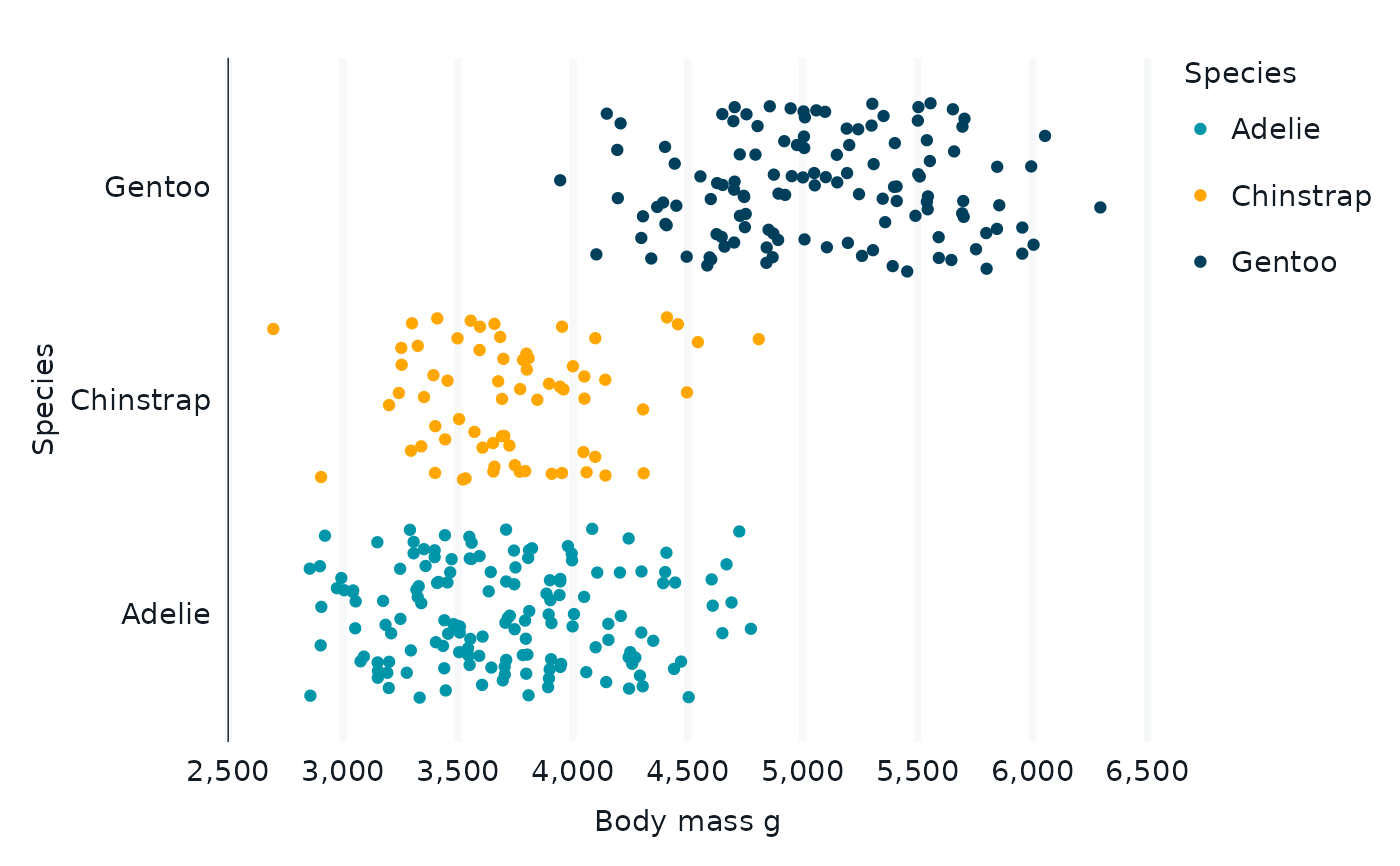
penguins |>
ggplot() +
geom_jitter(aes(x = body_mass_g, y = species, colour = species)) +
scale_x_symmetric(penguins, body_mass_g) +
theme(axis.line.x = element_blank()) +
theme(axis.ticks.x = element_blank()) +
theme(panel.grid.major.y = element_blank()) +
theme(axis.ticks.y = element_blank()) +
coord_cartesian(clip = "off") +
labs(x = "Body mass g", y = "Species", colour = "Species")
#> Warning: Removed 2 rows containing missing values or values outside the scale range
#> (`geom_point()`).