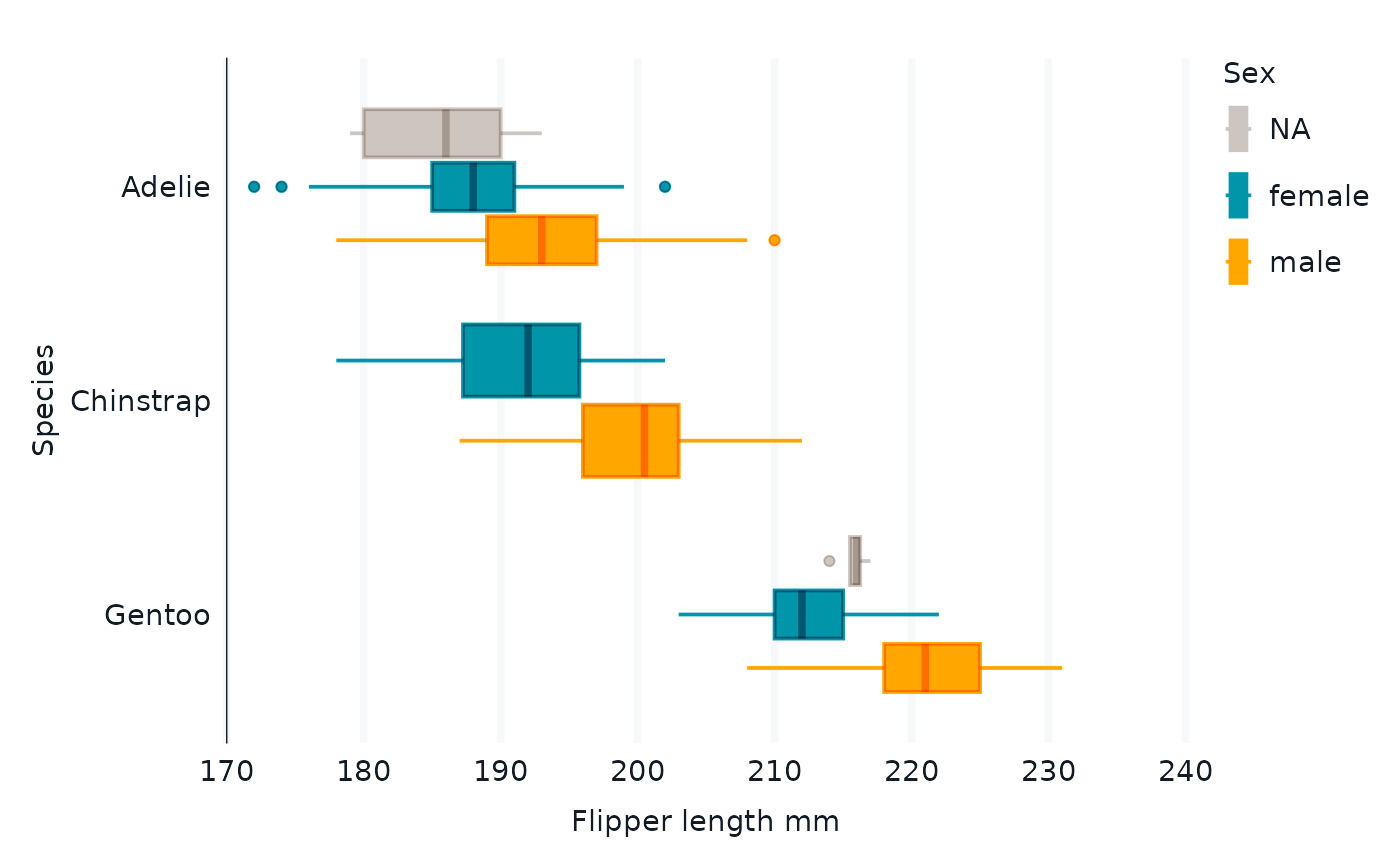
Create a boxplot ggplot with a wrapper around ggplot2::ggplot() + geom_boxplot().
Usage
gg_boxplot(
  data = NULL,
  ...,
  stat = "boxplot",
  position = "dodge2",
  coord = ggplot2::coord_cartesian(clip = "off"),
  theme = NULL,
  theme_orientation = NULL,
  theme_axis_line_rm = NULL,
  theme_axis_ticks_rm = NULL,
  theme_panel_grid_rm = NULL,
  blend = NULL,
  x = NULL,
  xmin = NULL,
  xmax = NULL,
  xend = NULL,
  y = NULL,
  ymin = NULL,
  ymax = NULL,
  yend = NULL,
  z = NULL,
  col = NULL,
  facet = NULL,
  facet2 = NULL,
  group = NULL,
  subgroup = NULL,
  label = NULL,
  text = NULL,
  sample = NULL,
  mapping = NULL,
  x_breaks = NULL,
  x_breaks_n = NULL,
  x_expand = NULL,
  x_limits_include = NULL,
  x_label = NULL,
  x_labels = NULL,
  x_position = "bottom",
  x_sec_axis = ggplot2::waiver(),
  x_symmetric = NULL,
  x_transform = NULL,
  y_breaks = NULL,
  y_breaks_n = NULL,
  y_expand = NULL,
  y_limits_include = NULL,
  y_label = NULL,
  y_labels = NULL,
  y_position = "left",
  y_sec_axis = ggplot2::waiver(),
  y_symmetric = NULL,
  y_transform = NULL,
  col_breaks = NULL,
  col_breaks_n = 5,
  col_drop = FALSE,
  col_limits_include = NULL,
  col_label = NULL,
  col_labels = NULL,
  col_legend_ncol = NULL,
  col_legend_nrow = NULL,
  col_legend_rev = FALSE,
  col_palette = NULL,
  col_palette_na = NULL,
  col_rescale = scales::rescale(),
  col_steps = FALSE,
  col_transform = NULL,
  facet_axes = NULL,
  facet_axis_labels = "margins",
  facet_drop = FALSE,
  facet_labels = NULL,
  facet_layout = NULL,
  facet_ncol = NULL,
  facet_nrow = NULL,
  facet_scales = "fixed",
  facet_space = "fixed",
  title = NULL,
  subtitle = NULL,
  caption = NULL,
  label_case = NULL
)
Arguments
- data
A data frame or tibble.
- ...
Other arguments passed to within a
paramslist inlayer().- stat
A statistical transformation to use on the data. A snakecase character string of a ggproto Stat subclass object minus the Stat prefix (e.g.
"identity").- position
A position adjustment. A snakecase character string of a ggproto Position subclass object minus the Position prefix (e.g.
"identity"), or aposition_*()function that outputs a ggproto Position subclass object (e.g.ggplot2::position_identity()).- coord
A coordinate system. A
coord_*()function that outputs a constructed ggproto Coord subclass object (e.g.ggplot2::coord_cartesian()).- theme
A ggplot2 theme (e.g.
light_mode_t()ordark_mode_r()). (Or a list that includes 1. a theme and 2. aggplot2::labs()function. E.g.list(light_mode_r(), labs(colour = NULL, fill = NULL)).- theme_orientation
The orientation of plot, which affects the theme components that are removed. Either
"x"or"y".- theme_axis_line_rm
TRUEorFALSEof whether to remove the relevant axis line per thetheme_orientationof the plot.- theme_axis_ticks_rm
TRUEorFALSEof whether to remove the relevant axis ticks per thetheme_orientationof the plot.- theme_panel_grid_rm
TRUEorFALSEof whether to remove the relevant panel grid per thetheme_orientationof the plot.- blend
The blending mode per
ggblend::blend()(e.g. "multiply").- x, xmin, xmax, xend, y, ymin, ymax, yend, z, col, facet, facet2, group, subgroup, label, text, sample
An unquoted aesthetic variable.
- mapping
A set of additional aesthetic mappings in
ggplot2::aes(). Intended primarily for non-supported aesthetics (e.g.shape,linetype,linewidth, orsize), but can also be used for delayed evaluation etc.- x_breaks, y_breaks, col_breaks
A
scales::breaks_*function (e.g.scales::breaks_*()), or a vector of breaks.- x_breaks_n, y_breaks_n, col_breaks_n
A number of desired breaks for when
*_breaks = NULL.- x_expand, y_expand
Padding to the limits with the
ggplot2::expansion()function, or a vector of length 2 (e.g.c(0, 0)).- x_limits_include, y_limits_include, col_limits_include
For a continuous variable, any values that the limits should encompass (e.g.
0). For a discrete scale, manipulate the data instead withforcats::fct_expand.- x_label, y_label, col_label
Label for the axis or legend title. Use
+ ggplot2::labs(... = NULL)for no title.- x_labels, y_labels, col_labels, facet_labels
A function that takes the breaks as inputs (e.g.
\(x) stringr::str_to_sentence(x)orscales::label_*()), or a vector of labels. (Note this must be named forfacet_labels).- x_position, y_position
The position of the axis (i.e.
"left","right","bottom"or"top").If usingy_position = "top"with a*_theme_*theme, addcaption = ""orcaption = "\n".- x_sec_axis, y_sec_axis
A secondary axis with
ggplot2::dup_axis()orggplot2::sec_axis().- x_symmetric, y_symmetric
TRUEorFALSEof whether a symmetric scale.- x_transform, y_transform, col_transform
For a continuous scale, a transformation object (e.g.
scales::transform_log10()) or character string of this minus thetransform_prefix (e.g."log10").- col_drop, facet_drop
For a discrete variable, FALSE or TRUE of whether to drop unused levels.
- col_legend_ncol, col_legend_nrow
The number of columns and rows in a legend guide.
- col_legend_rev
TRUEorFALSEof whether to reverse the elements of a legend guide. Defaults toFALSE.- col_palette
A character vector of hex codes (or names) or a
scales::pal_*()function.- col_palette_na
A hex code (or name) for the colour of
NAvalues.- col_rescale
For a continuous variable, a
scales::rescale()function.- col_steps
For a continuous variable,
TRUEorFALSEof whether to colour in steps. Defaults toFALSE.- facet_axes
Whether to add interior axes and ticks with
"margins","all","all_x", or"all_y". Sometimes+ *_theme_*()may be needed.- facet_axis_labels
Whether to add interior axis labels with
"margins","all","all_x", or"all_y".- facet_layout
Whether the layout is to be
"wrap"or"grid". IfNULLand a singlefacet(orfacet2) argument is provided, then defaults to"wrap". IfNULLand both facet and facet2 arguments are provided, defaults to"grid".- facet_ncol, facet_nrow
The number of columns and rows of facet panels. Only applies to a facet layout of
"wrap".- facet_scales
Whether facet scales should be
"fixed"across facets,"free"in both directions, or free in just one direction (i.e."free_x"or"free_y"). Defaults to"fixed".- facet_space
When the facet scales are not
"fixed", whether facet space should be"fixed"across facets,"free"to be proportional in both directions, or free to be proportional in just one direction (i.e."free_x"or"free_y"). Defaults to"fixed".- title
Title string.
- subtitle
Subtitle string.
- caption
Caption title string.
- label_case
A function to format the label of unlabelled variables. Defaults to
snakecase::to_sentence_case.
Examples
library(ggplot2)
library(dplyr)
library(palmerpenguins)

set_blanket()
#> Warning: Duplicated aesthetics after name standardisation: fill
#> Warning: Duplicated aesthetics after name standardisation: fill

penguins |>
  gg_boxplot(
    x = flipper_length_mm,
    y = species,
    col = sex,
    blend = "multiply",
  )
#> Scale for colour is already present.
#> Adding another scale for colour, which will replace the existing scale.
#> Warning: Removed 2 rows containing non-finite outside the scale range
#> (`stat_boxplot()`).

