Binds data to support plotting each category and all combined data.
Arguments
- data
A data frame or tibble.
- ...
An unquoted variable.
- name
A variable name. Defaults to
each_all.- each
A string for the each value. Defaults to
"Each".- all
A string for the all value. Defaults to
"All".- all_after
A number for where the all value should be placed after. Use
0for first orInffor last. Defaults toInf.
Examples
library(dplyr)
library(ggplot2)
library(palmerpenguins)
set_blanket()
#> Warning: Duplicated aesthetics after name standardisation: fill
#> Warning: Duplicated aesthetics after name standardisation: fill
penguins |>
count(species)
#> # A tibble: 3 × 2
#> species n
#> <fct> <int>
#> 1 Adelie 152
#> 2 Chinstrap 68
#> 3 Gentoo 124
penguins |>
bind_each_all(species) |>
count(species, each_all)
#> # A tibble: 4 × 3
#> species each_all n
#> <fct> <fct> <int>
#> 1 Adelie Each 152
#> 2 Chinstrap Each 68
#> 3 Gentoo Each 124
#> 4 All All 344
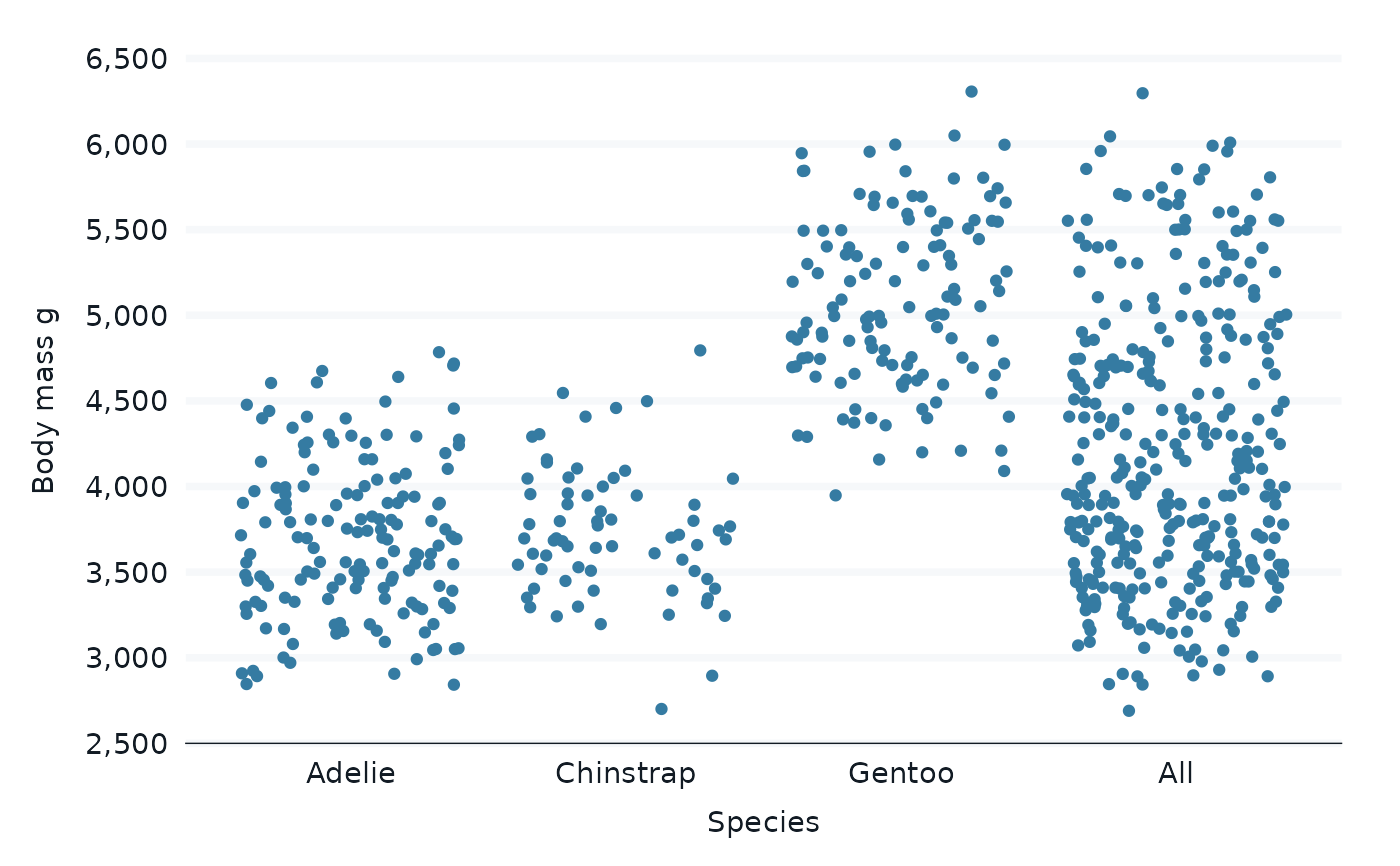
penguins |>
bind_each_all(species) |>
gg_jitter(
x = species,
y = body_mass_g,
)
#> Warning: Removed 4 rows containing missing values or values outside the scale range
#> (`geom_point()`).
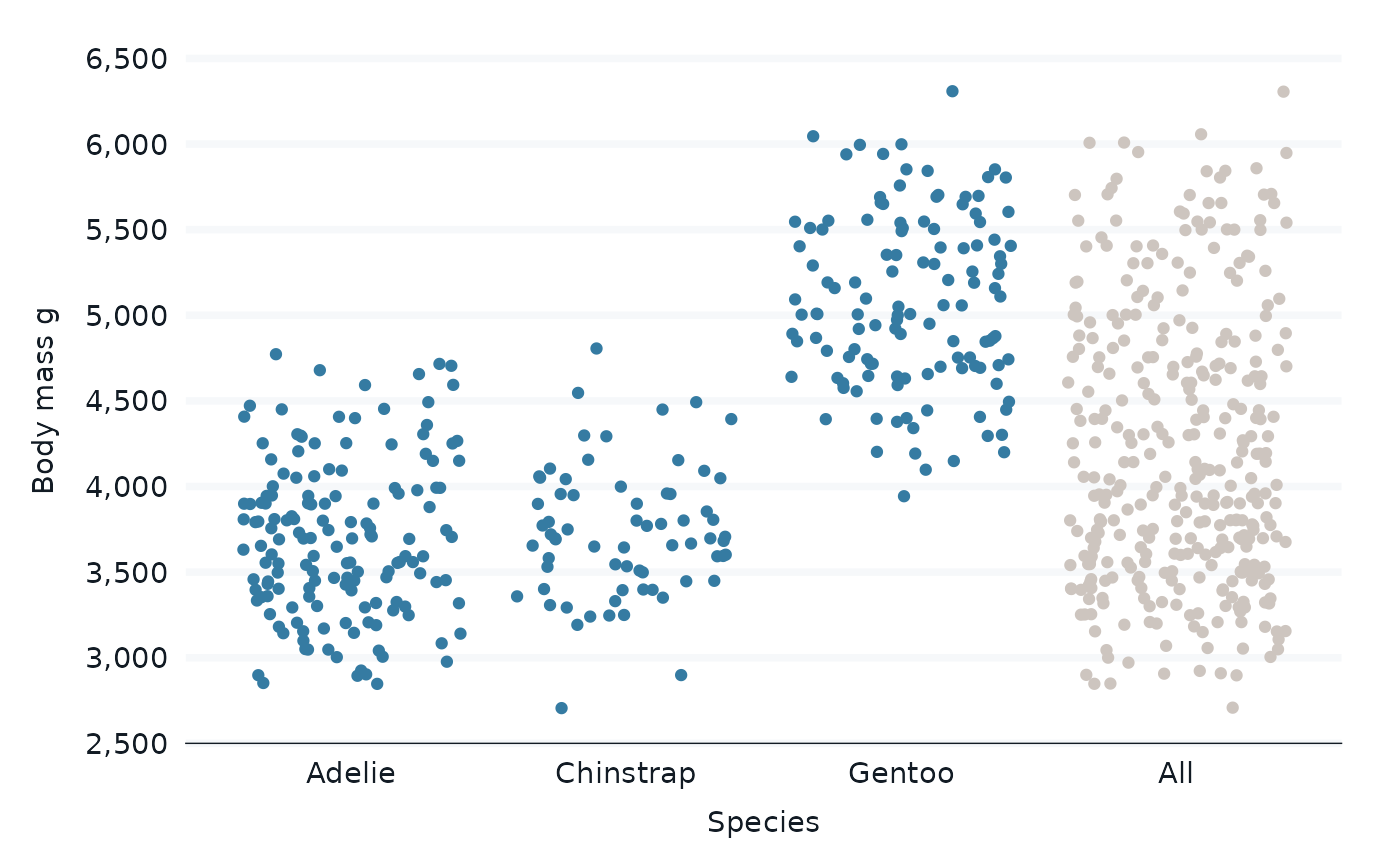
 penguins |>
bind_each_all(species) |>
gg_jitter(
x = species,
y = body_mass_g,
col = each_all,
col_palette = c(blue, grey),
) +
theme(legend.position = "none")
#> Scale for colour is already present.
#> Adding another scale for colour, which will replace the existing scale.
#> Warning: Removed 4 rows containing missing values or values outside the scale range
#> (`geom_point()`).
penguins |>
bind_each_all(species) |>
gg_jitter(
x = species,
y = body_mass_g,
col = each_all,
col_palette = c(blue, grey),
) +
theme(legend.position = "none")
#> Scale for colour is already present.
#> Adding another scale for colour, which will replace the existing scale.
#> Warning: Removed 4 rows containing missing values or values outside the scale range
#> (`geom_point()`).
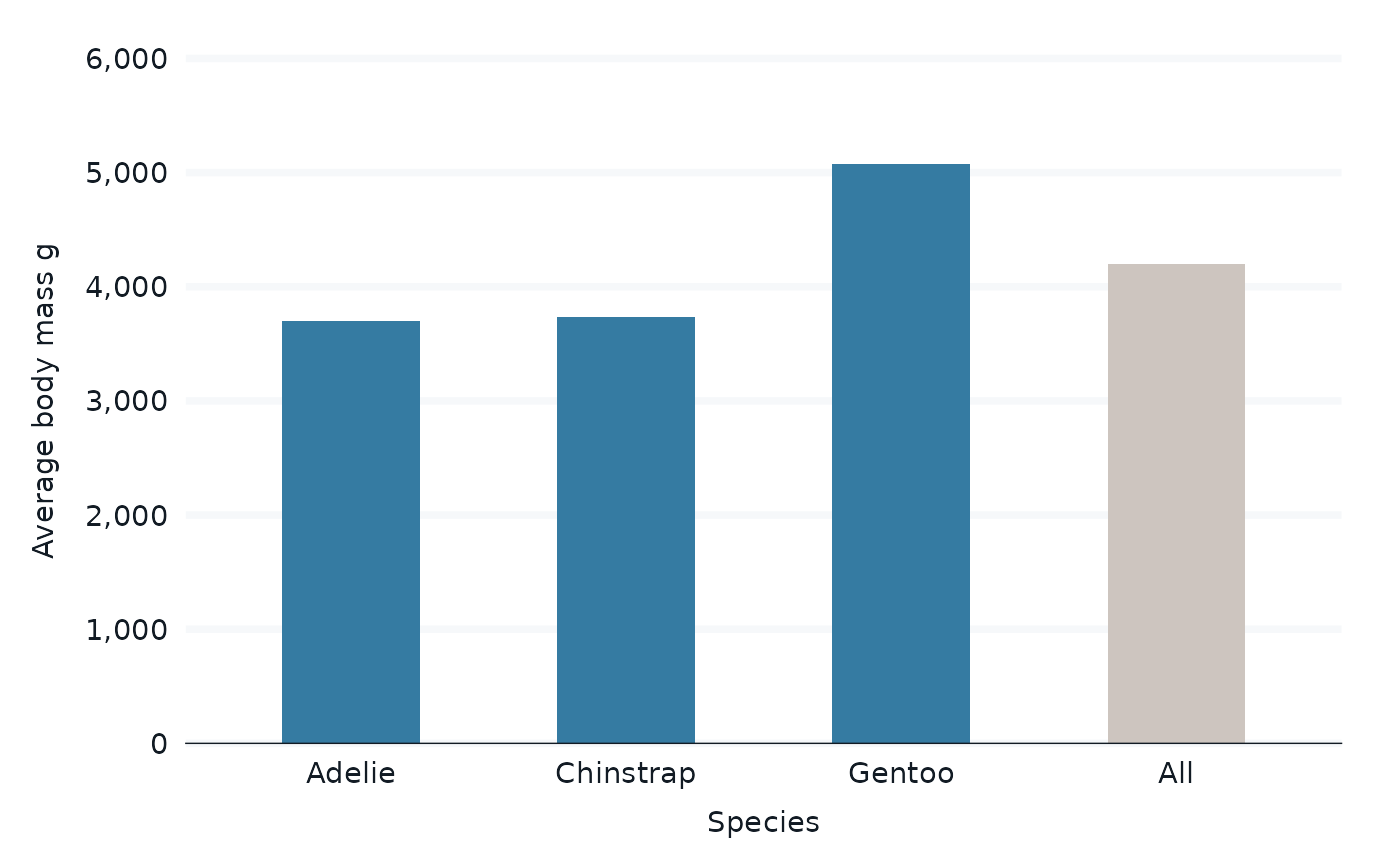
 penguins |>
bind_each_all(species) |>
group_by(species, each_all) |>
summarise(across(body_mass_g, \(x) mean(x, na.rm = TRUE))) |>
gg_col(
x = species,
y = body_mass_g,
col = each_all,
col_palette = c(blue, grey),
width = 0.5,
y_label = "Average body mass g",
) +
theme(legend.position = "none")
#> `summarise()` has regrouped the output.
#> ℹ Summaries were computed grouped by species and each_all.
#> ℹ Output is grouped by species.
#> ℹ Use `summarise(.groups = "drop_last")` to silence this message.
#> ℹ Use `summarise(.by = c(species, each_all))` for per-operation grouping
#> (`?dplyr::dplyr_by`) instead.
#> Scale for colour is already present.
#> Adding another scale for colour, which will replace the existing scale.
penguins |>
bind_each_all(species) |>
group_by(species, each_all) |>
summarise(across(body_mass_g, \(x) mean(x, na.rm = TRUE))) |>
gg_col(
x = species,
y = body_mass_g,
col = each_all,
col_palette = c(blue, grey),
width = 0.5,
y_label = "Average body mass g",
) +
theme(legend.position = "none")
#> `summarise()` has regrouped the output.
#> ℹ Summaries were computed grouped by species and each_all.
#> ℹ Output is grouped by species.
#> ℹ Use `summarise(.groups = "drop_last")` to silence this message.
#> ℹ Use `summarise(.by = c(species, each_all))` for per-operation grouping
#> (`?dplyr::dplyr_by`) instead.
#> Scale for colour is already present.
#> Adding another scale for colour, which will replace the existing scale.
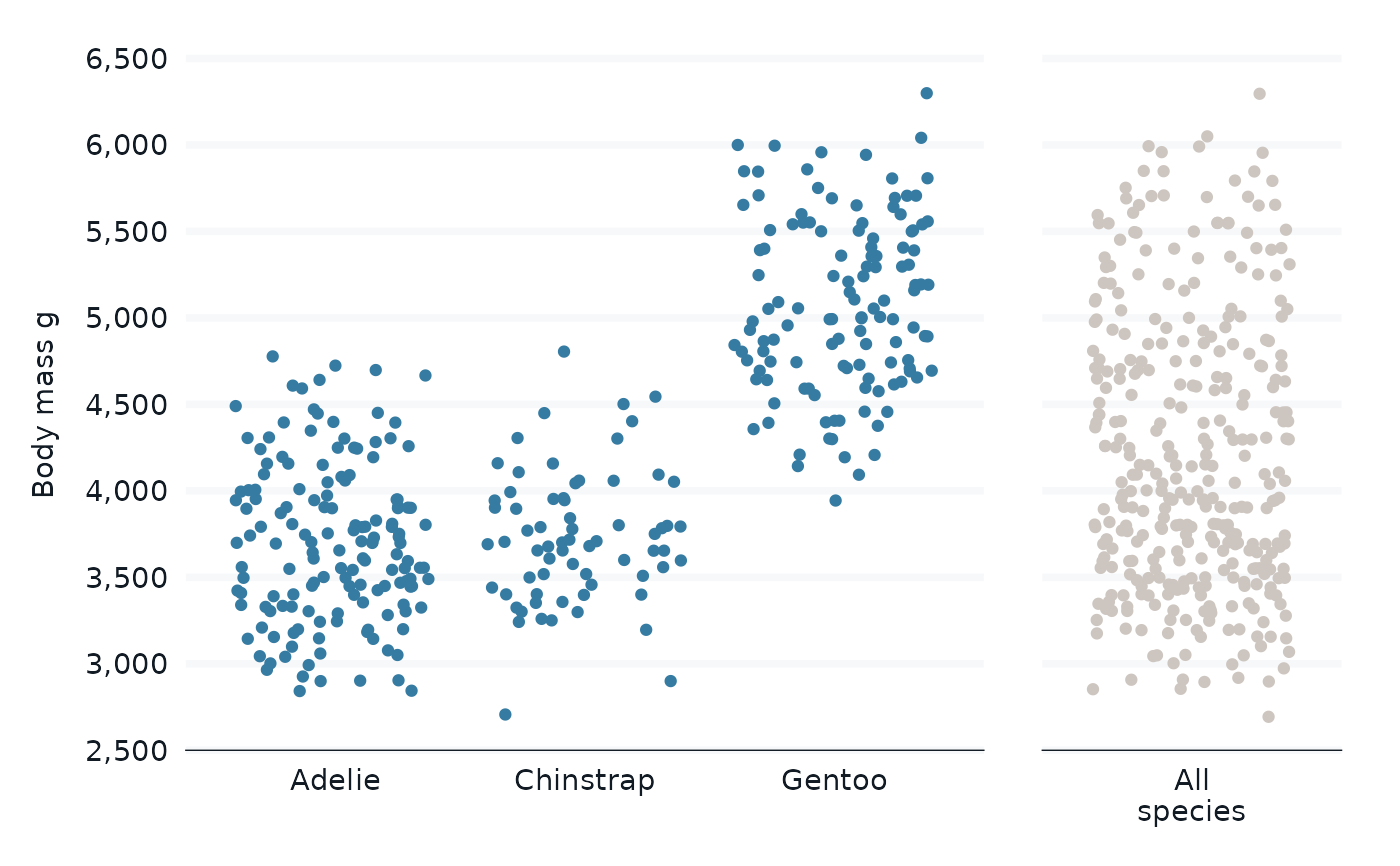
 penguins |>
bind_each_all(species, all = "All\nspecies") |>
gg_jitter(
x = species,
y = body_mass_g,
col = each_all,
col_palette = c(blue, grey),
facet = each_all,
facet_layout = "grid",
facet_scales = "free_x",
facet_space = "free_x",
) +
theme(legend.position = "none") +
theme(strip.text.x = element_blank()) +
labs(x = NULL)
#> Scale for colour is already present.
#> Adding another scale for colour, which will replace the existing scale.
#> Warning: Removed 4 rows containing missing values or values outside the scale range
#> (`geom_point()`).
penguins |>
bind_each_all(species, all = "All\nspecies") |>
gg_jitter(
x = species,
y = body_mass_g,
col = each_all,
col_palette = c(blue, grey),
facet = each_all,
facet_layout = "grid",
facet_scales = "free_x",
facet_space = "free_x",
) +
theme(legend.position = "none") +
theme(strip.text.x = element_blank()) +
labs(x = NULL)
#> Scale for colour is already present.
#> Adding another scale for colour, which will replace the existing scale.
#> Warning: Removed 4 rows containing missing values or values outside the scale range
#> (`geom_point()`).