Bind all the data to itself by a variable for plotting of groups against all data.
Usage
bind_all_by(
  data,
  by,
  ...,
  name = "groups_or_all",
  groups = "Groups",
  all = "All",
  all_after = Inf
)
Arguments
- data
A data frame or tibble.
- by
An unquoted character or factor variable.
- ...
Provided to require argument naming, support trailing commas etc.
- name
A variable name. Defaults to
groups_or_all.- groups
A string for the group value. Defaults to
"Groups".- all
A string for the all value. Defaults to
"All".- all_after
A number for where the all value should be placed after. Use 0 for first or Inf for last. Defaults to Inf.
Examples
library(dplyr)
library(ggplot2)
library(palmerpenguins)
set_blanket()
penguins |>
bind_all_by(species) |>
distinct(species, groups_or_all)
#> # A tibble: 4 × 2
#> species groups_or_all
#> <fct> <fct>
#> 1 Adelie Groups
#> 2 Gentoo Groups
#> 3 Chinstrap Groups
#> 4 All All
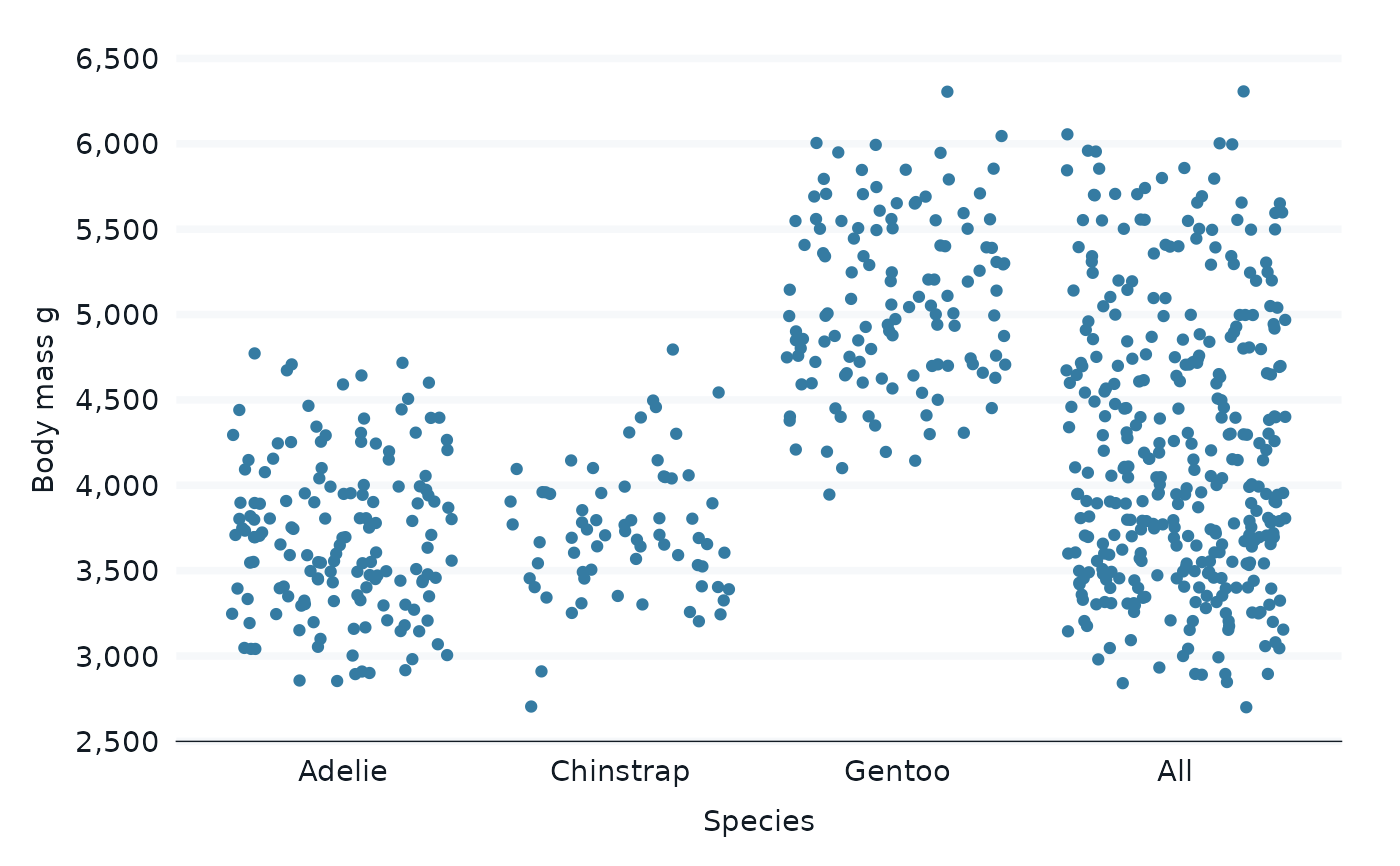
penguins |>
bind_all_by(species) |>
gg_jitter(
x = species,
y = body_mass_g,
)
#> Warning: Removed 4 rows containing missing values or values outside the scale range
#> (`geom_point()`).
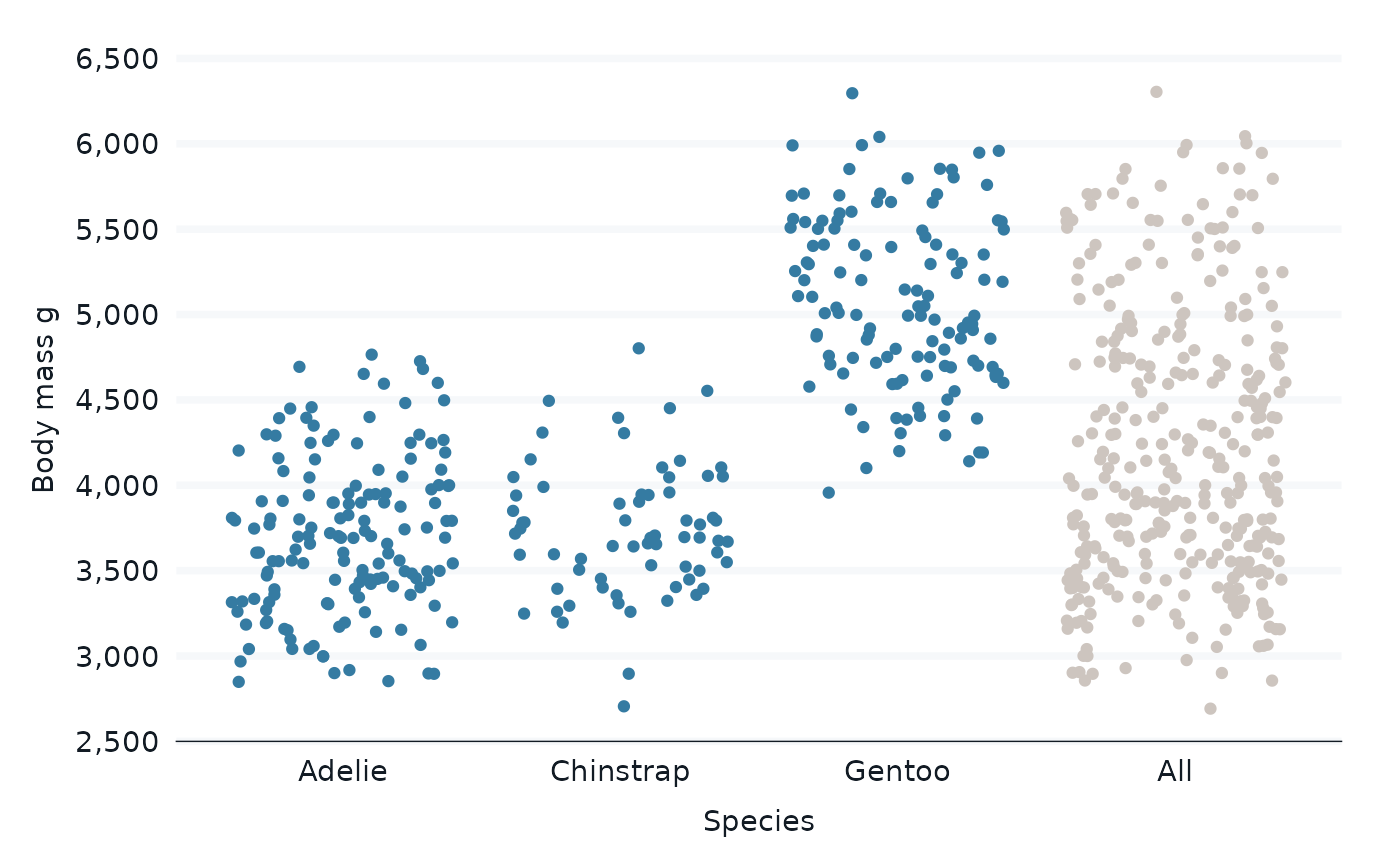
 penguins |>
bind_all_by(species) |>
gg_jitter(
x = species,
y = body_mass_g,
col = groups_or_all,
col_palette = c(blue, grey),
) +
theme(legend.position = "none")
#> Scale for colour is already present.
#> Adding another scale for colour, which will replace the existing scale.
#> Warning: Removed 4 rows containing missing values or values outside the scale range
#> (`geom_point()`).
penguins |>
bind_all_by(species) |>
gg_jitter(
x = species,
y = body_mass_g,
col = groups_or_all,
col_palette = c(blue, grey),
) +
theme(legend.position = "none")
#> Scale for colour is already present.
#> Adding another scale for colour, which will replace the existing scale.
#> Warning: Removed 4 rows containing missing values or values outside the scale range
#> (`geom_point()`).
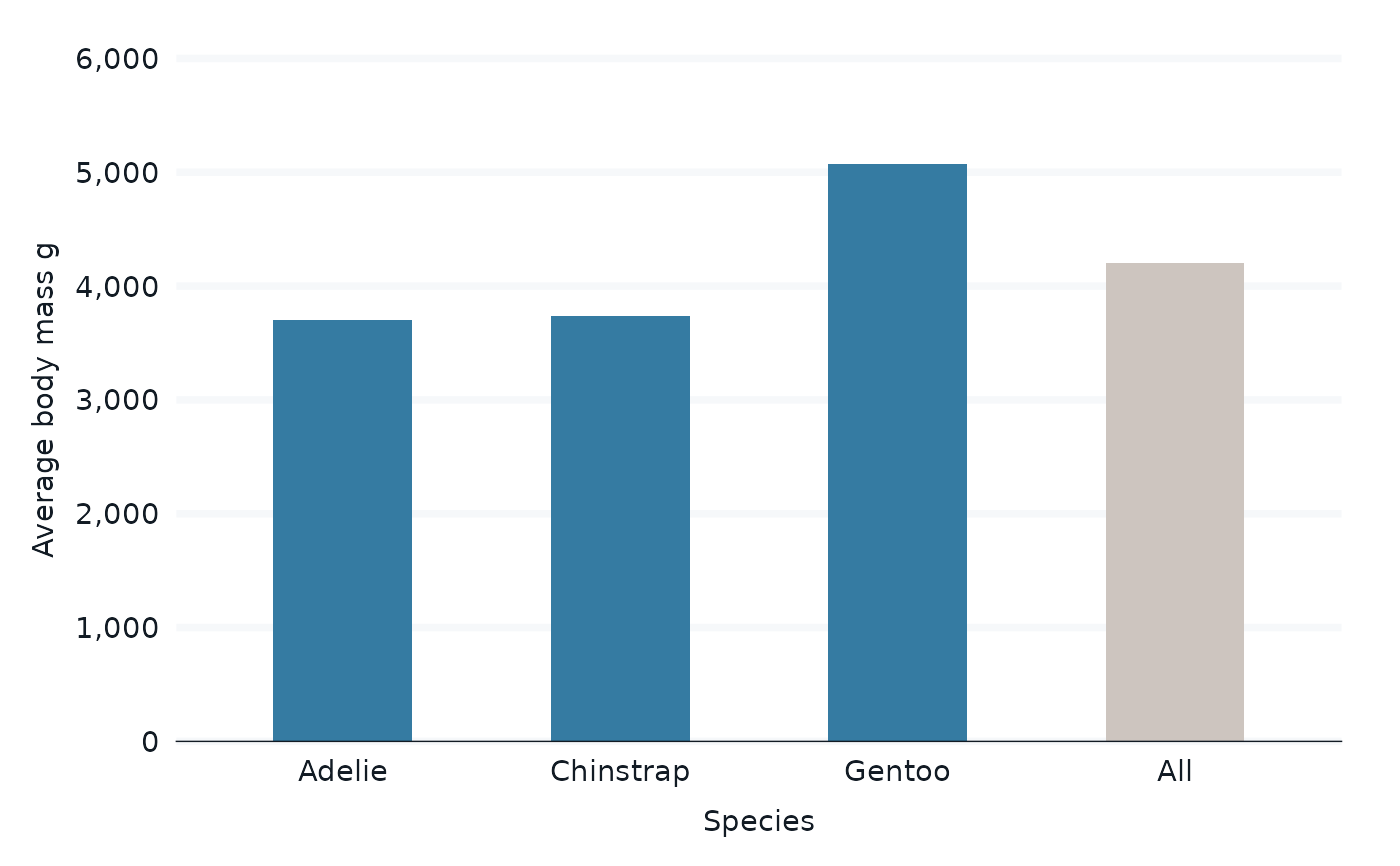
 penguins |>
bind_all_by(species) |>
group_by(species, groups_or_all) |>
summarise(across(body_mass_g, \(x) mean(x, na.rm = TRUE))) |>
gg_col(
x = species,
y = body_mass_g,
col = groups_or_all,
col_palette = c(blue, grey),
width = 0.5,
y_label = "Average body mass g",
) +
theme(legend.position = "none")
#> `summarise()` has grouped output by 'species'. You can override using the
#> `.groups` argument.
#> Scale for colour is already present.
#> Adding another scale for colour, which will replace the existing scale.
penguins |>
bind_all_by(species) |>
group_by(species, groups_or_all) |>
summarise(across(body_mass_g, \(x) mean(x, na.rm = TRUE))) |>
gg_col(
x = species,
y = body_mass_g,
col = groups_or_all,
col_palette = c(blue, grey),
width = 0.5,
y_label = "Average body mass g",
) +
theme(legend.position = "none")
#> `summarise()` has grouped output by 'species'. You can override using the
#> `.groups` argument.
#> Scale for colour is already present.
#> Adding another scale for colour, which will replace the existing scale.
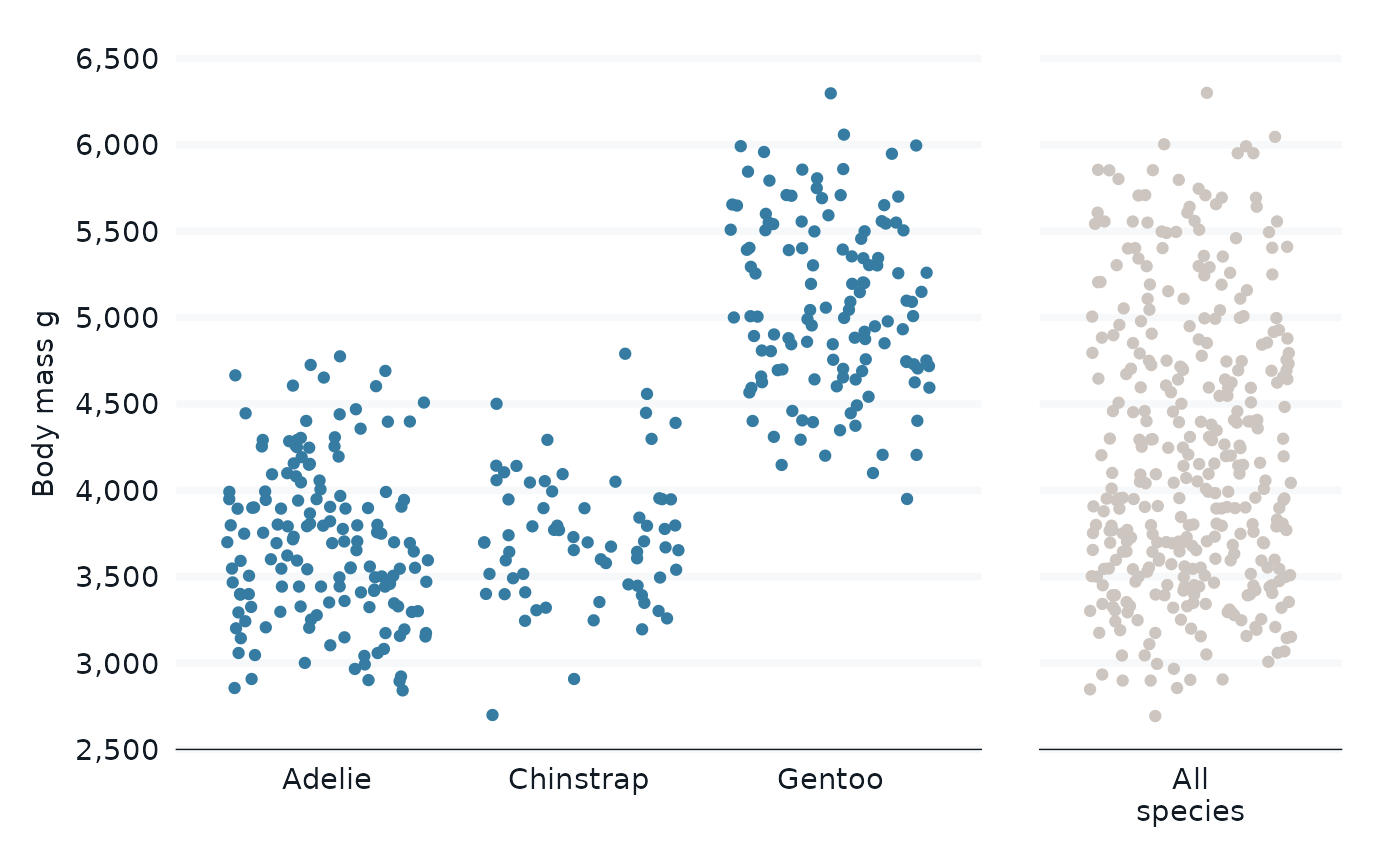
 penguins |>
bind_all_by(species, all = "All\nspecies") |>
gg_jitter(
x = species,
y = body_mass_g,
col = groups_or_all,
col_palette = c(blue, grey),
facet = groups_or_all,
facet_layout = "grid",
facet_scales = "free_x",
facet_space = "free_x",
) +
theme(legend.position = "none") +
theme(strip.text.x = element_blank()) +
labs(x = NULL)
#> Scale for colour is already present.
#> Adding another scale for colour, which will replace the existing scale.
#> Warning: Removed 4 rows containing missing values or values outside the scale range
#> (`geom_point()`).
penguins |>
bind_all_by(species, all = "All\nspecies") |>
gg_jitter(
x = species,
y = body_mass_g,
col = groups_or_all,
col_palette = c(blue, grey),
facet = groups_or_all,
facet_layout = "grid",
facet_scales = "free_x",
facet_space = "free_x",
) +
theme(legend.position = "none") +
theme(strip.text.x = element_blank()) +
labs(x = NULL)
#> Scale for colour is already present.
#> Adding another scale for colour, which will replace the existing scale.
#> Warning: Removed 4 rows containing missing values or values outside the scale range
#> (`geom_point()`).