Draws grid lines at specified break positions with style defaults taken from
the panel.grid element of the set theme. Specify x for vertical lines
or y for horizontal lines.
Usage
annotate_panel_grid(
  ...,
  x = NULL,
  y = NULL,
  xmin = NULL,
  xmax = NULL,
  ymin = NULL,
  ymax = NULL,
  minor = FALSE,
  colour = NULL,
  linewidth = NULL,
  linetype = NULL,
  element_to = "keep"
)
Arguments
- ...
Not used. Allows trailing commas and named-argument style calls.
- x
A vector of x-axis breaks for vertical grid lines. Cannot be used together with
y. UseI()for normalized coordinates (0-1).- y
A vector of y-axis breaks for horizontal grid lines. Cannot be used together with
x. UseI()for normalized coordinates (0-1).- xmin, xmax
Start and end x positions for horizontal grid lines. Use
I()for normalized coordinates (0-1). Defaults to-InfandInf.- ymin, ymax
Start and end y positions for vertical grid lines. Use
I()for normalized coordinates (0-1). Defaults to-InfandInf.- minor
Logical. If
TRUE, uses minor grid theme defaults. Defaults toFALSE.- colour
Inherits from
panel.grid.majororpanel.grid.minorin the set theme.- linewidth
Inherits from
panel.grid.majororpanel.grid.minorin the set theme. Supportsrel().- linetype
Inherits from
panel.grid.majororpanel.grid.minorin the set theme.- element_to
One of
"keep","transparent", or"blank". Controls whether native theme grid lines are suppressed. Defaults to"keep".
Examples
library(ggplot2)
set_theme(theme_minimal())
p <- ggplot(mtcars, aes(wt, mpg)) +
geom_point()
# Vertical grid lines at specific x breaks
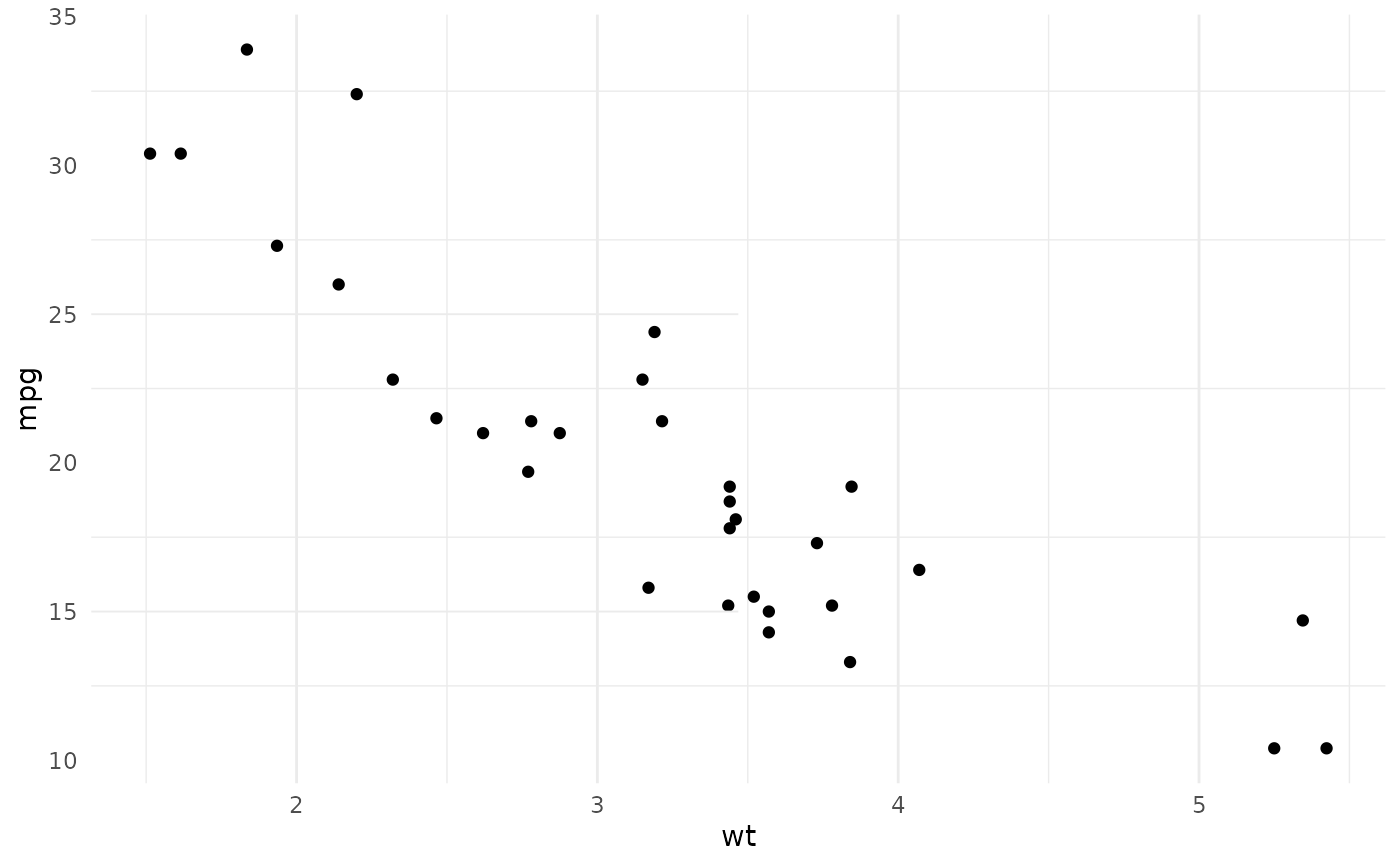
p + annotate_panel_grid(x = c(2, 3, 4, 5))
 # Horizontal grid lines at specific y breaks, native lines suppressed
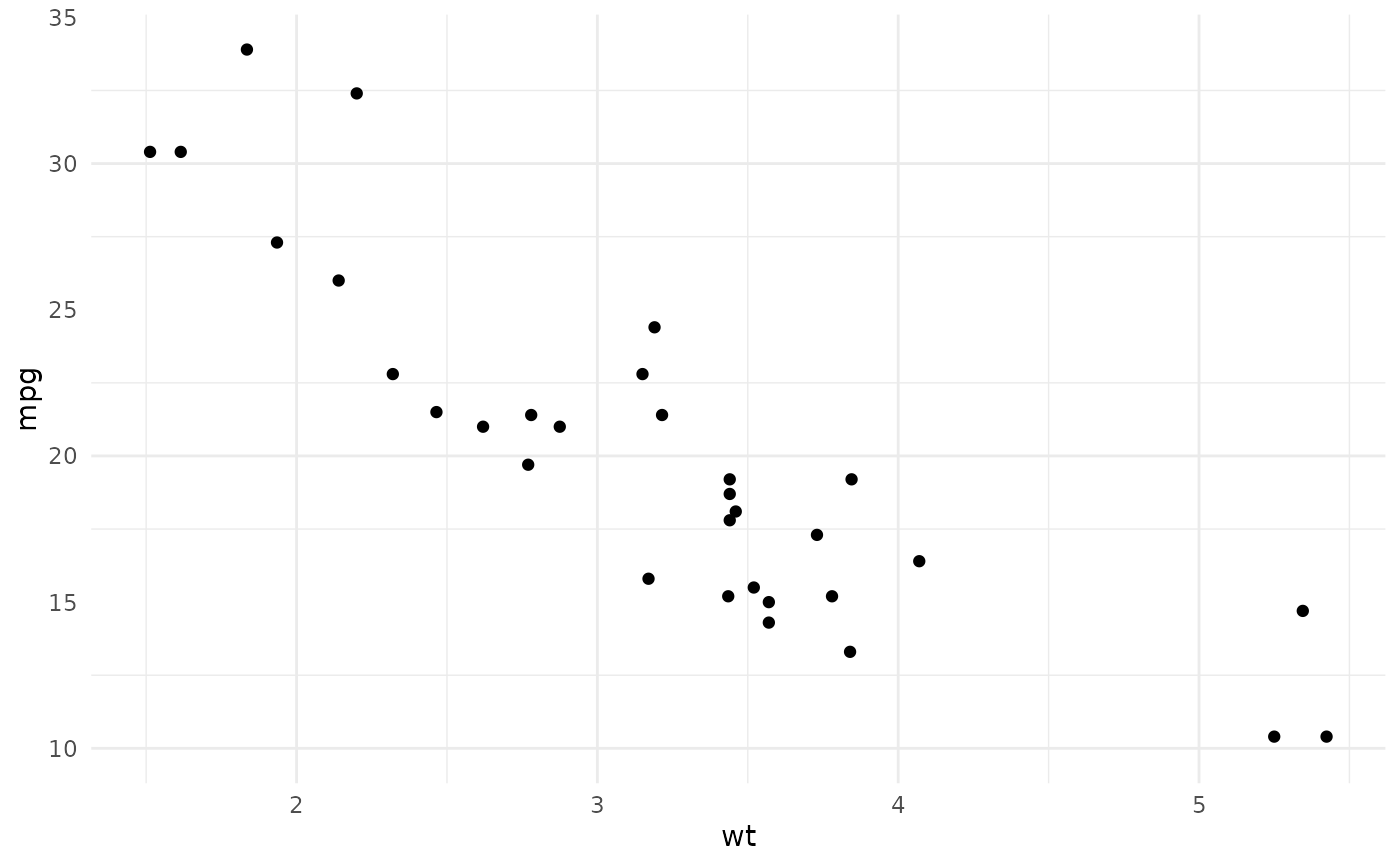
p + annotate_panel_grid(y = c(10, 20, 30), element_to = "transparent")
# Horizontal grid lines at specific y breaks, native lines suppressed
p + annotate_panel_grid(y = c(10, 20, 30), element_to = "transparent")
 # Minor vertical grid lines
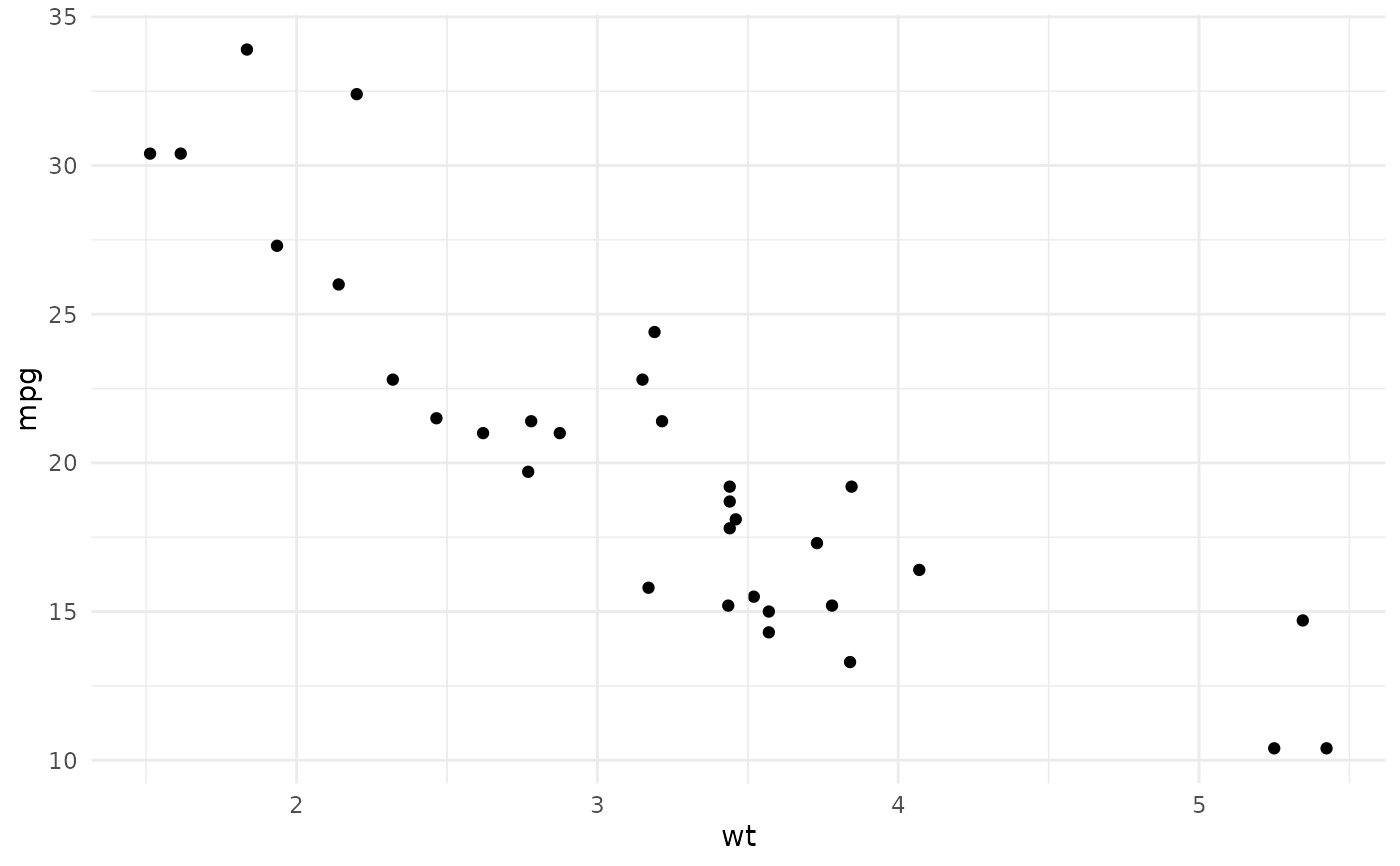
p + annotate_panel_grid(x = seq(2, 5, by = 0.5), minor = TRUE)
# Minor vertical grid lines
p + annotate_panel_grid(x = seq(2, 5, by = 0.5), minor = TRUE)
 # Partial horizontal lines that don't span the full panel width
p + annotate_panel_grid(y = c(15, 25), xmax = I(0.5), element_to = "transparent")
# Partial horizontal lines that don't span the full panel width
p + annotate_panel_grid(y = c(15, 25), xmax = I(0.5), element_to = "transparent")