Draws axis ticks at specified break positions, with style defaults taken
from the axis.ticks element of the set theme. Ticks along or outside the
panel boundary requires coord_cartesian(clip = "off").
Usage
annotate_axis_ticks(
  ...,
  position = NULL,
  x = NULL,
  y = NULL,
  minor = FALSE,
  colour = NULL,
  linewidth = NULL,
  tick_length = NULL,
  element_to = "keep"
)
Arguments
- ...
Not used. Allows trailing commas and named-argument style calls.
- position
One of
"top","bottom","left", or"right".- x
A vector of x-axis break positions for top/bottom ticks. Use
I()for normalized coordinates (0-1).- y
A vector of y-axis break positions for left/right ticks. Use
I()for normalized coordinates (0-1).- minor
Logical. If
TRUE, uses minor tick theme defaults. Defaults toFALSE.- colour
Inherits from
axis.ticksin the set theme.- linewidth
Inherits from
axis.ticksin the set theme. Supportsrel().- tick_length
Total tick length as a grid unit. Supports
rel()to scale relative to the theme default. Negative values flip the tick direction.- element_to
One of
"keep","transparent", or"blank". Controls whether native theme ticks are suppressed. Defaults to"keep".
Examples
library(ggplot2)
set_theme(theme_classic())
p <- ggplot(mtcars, aes(wt, mpg)) +
geom_point() +
coord_cartesian(clip = "off")
# Bottom ticks at specific breaks
p + annotate_axis_ticks(position = "bottom", x = c(2, 3, 4, 5))
 # Left ticks with native ticks suppressed
p + annotate_axis_ticks(position = "left", y = c(10, 20, 30), element_to = "transparent")
# Left ticks with native ticks suppressed
p + annotate_axis_ticks(position = "left", y = c(10, 20, 30), element_to = "transparent")
 # Inward ticks using a negative length
p + annotate_axis_ticks(position = "bottom", x = c(2, 3, 4, 5), tick_length = grid::unit(-5, "pt"))
# Inward ticks using a negative length
p + annotate_axis_ticks(position = "bottom", x = c(2, 3, 4, 5), tick_length = grid::unit(-5, "pt"))
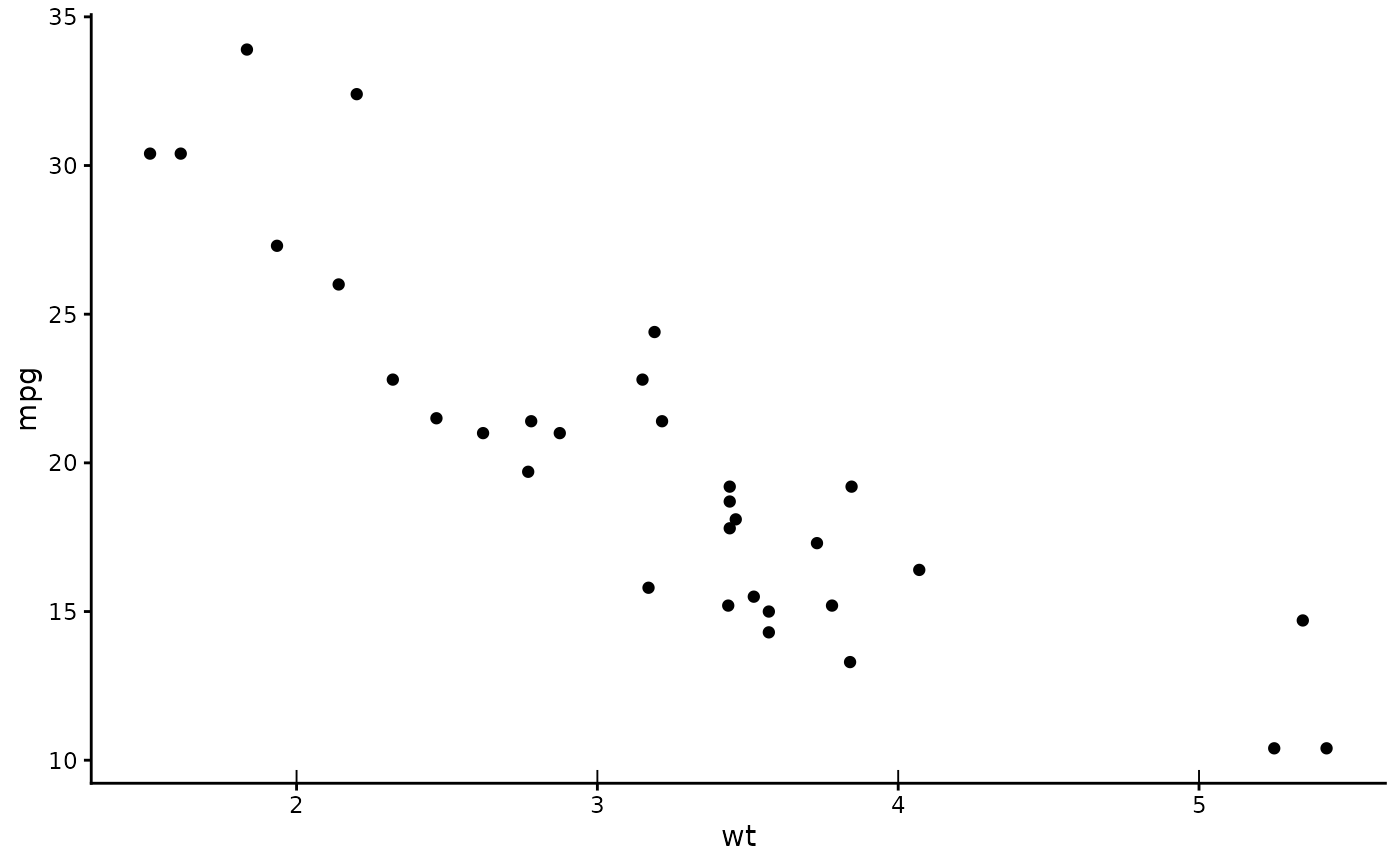 # Minor ticks
p + annotate_axis_ticks(position = "bottom", x = seq(2, 5, by = 0.5), minor = TRUE)
# Minor ticks
p + annotate_axis_ticks(position = "bottom", x = seq(2, 5, by = 0.5), minor = TRUE)
