Draws text labels at specified break positions along an axis, with style
defaults taken from the axis.text element of the set theme. Text along or
outside the panel boundary requires coord_cartesian(clip = "off"). Can also
place labels at arbitrary (x, y) coordinates when both x and y are
provided.
Usage
annotate_axis_text(
  ...,
  position = NULL,
  x = NULL,
  y = NULL,
  label = NULL,
  colour = NULL,
  size = NULL,
  family = NULL,
  tick_length = NULL,
  hjust = NULL,
  vjust = NULL,
  angle = 0,
  element_to = "keep"
)
Arguments
- ...
Not used. Allows trailing commas and named-argument style calls.
- position
One of
"top","bottom","left", or"right". Inferred fromx/yif not provided.- x
A vector of x positions. Use
I()for normalized coordinates (0-1). When combined withy, triggers arbitrary positioning mode.- y
A vector of y positions. Use
I()for normalized coordinates (0-1). When combined withx, triggers arbitrary positioning mode.- label
A vector of labels or a function that takes breaks and returns labels. Defaults to formatted break values.
- colour
Inherits from
axis.textin the set theme.- size
Inherits from
axis.textin the set theme.- family
Inherits from
axis.textin the set theme.- tick_length
Offset from the axis edge as a grid unit, including tick length and margin. Supports
rel(). Negative values place labels on the inside of the panel. Axis mode only.- hjust, vjust
Justification. Auto-calculated from position if
NULL.- angle
Text rotation angle. Defaults to
0.- element_to
One of
"keep","transparent", or"blank". Controls whether native theme axis text is suppressed. Defaults to"keep". Axis mode only.
Examples
library(ggplot2)
set_theme(theme_classic())
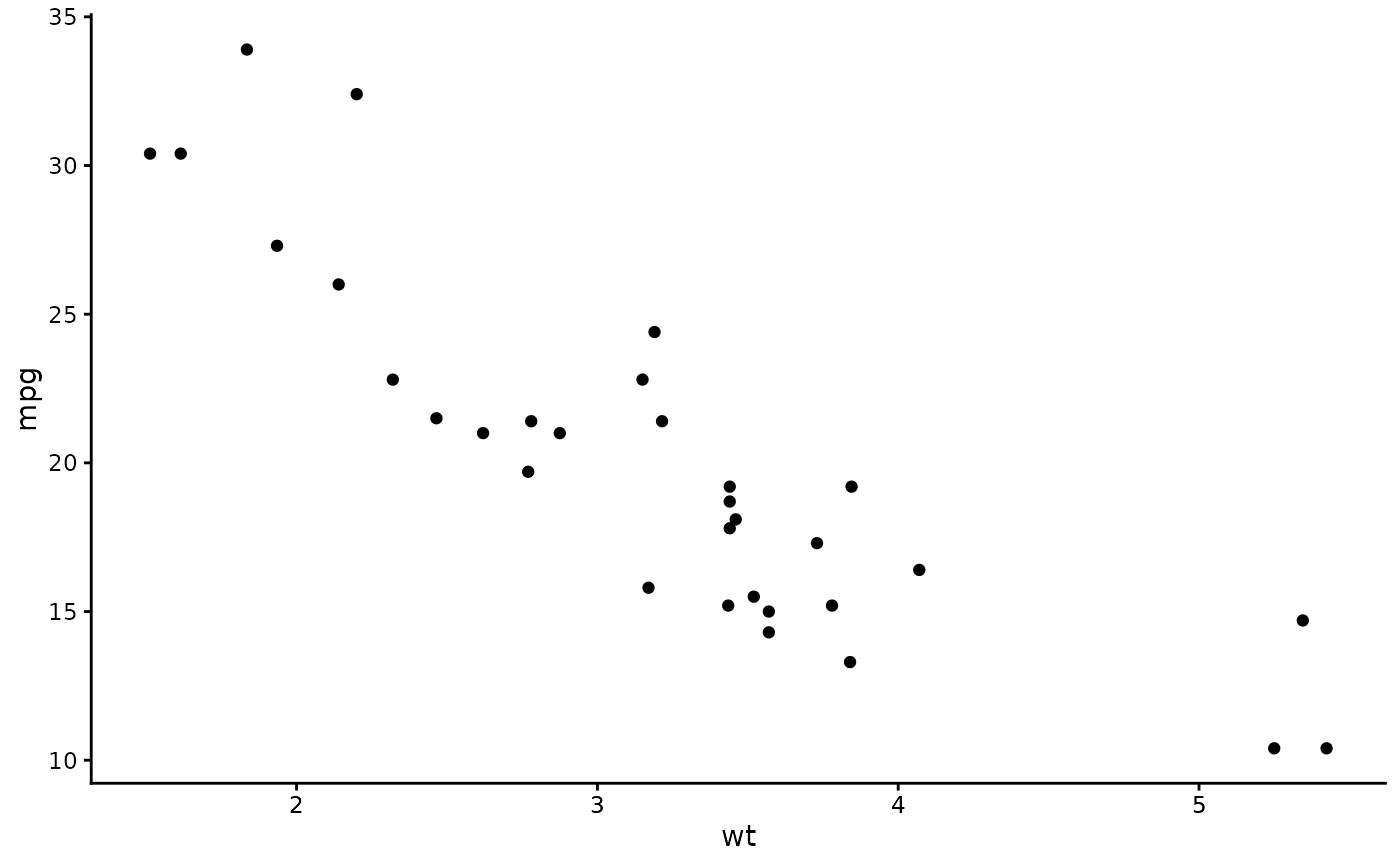
p <- ggplot(mtcars, aes(wt, mpg)) +
geom_point() +
coord_cartesian(clip = "off")
# Bottom axis labels at specific breaks
p + annotate_axis_text(position = "bottom", x = c(2, 3, 4, 5))
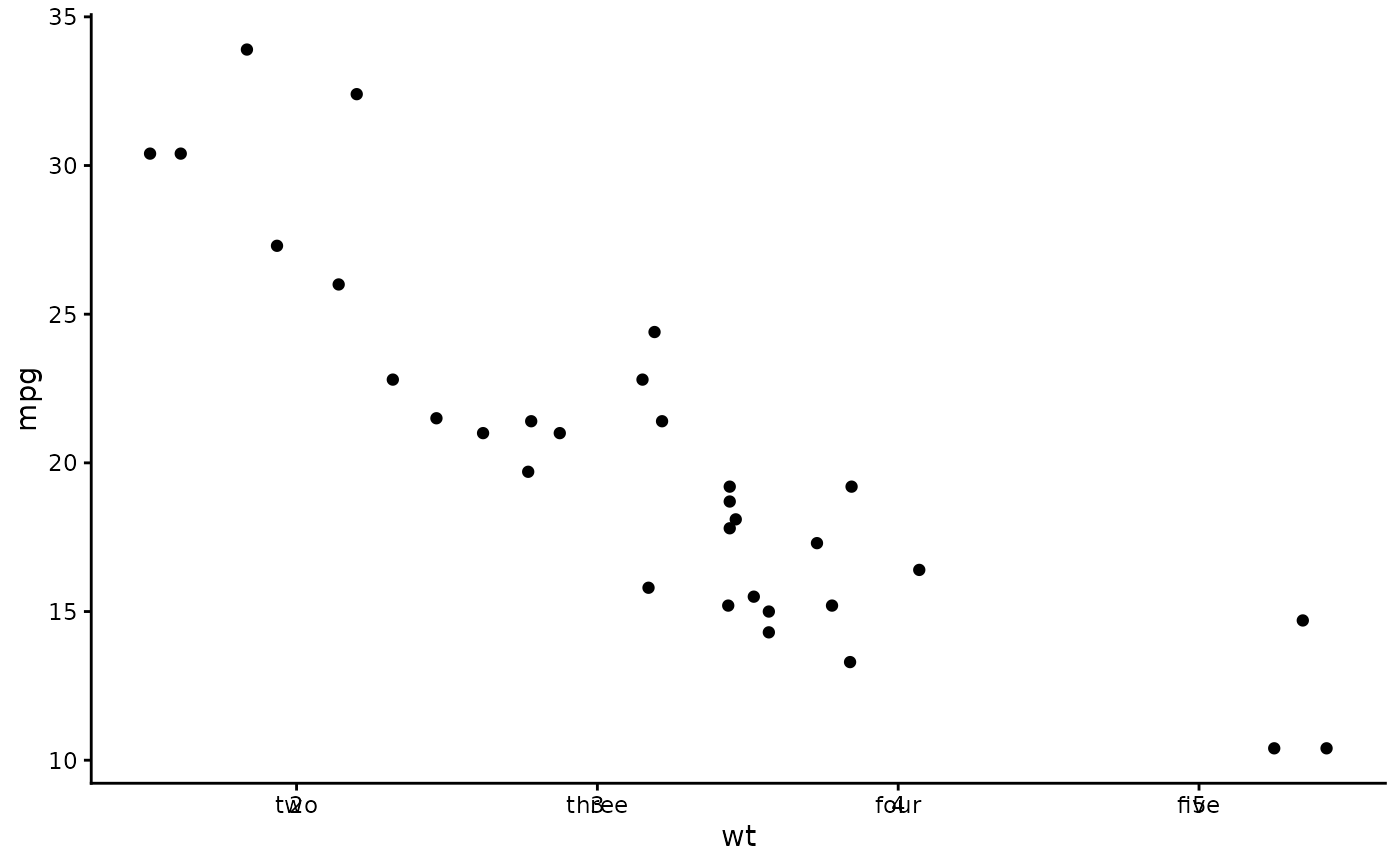
 # Custom labels
p + annotate_axis_text(position = "bottom", x = c(2, 3, 4, 5),
label = c("two", "three", "four", "five"))
# Custom labels
p + annotate_axis_text(position = "bottom", x = c(2, 3, 4, 5),
label = c("two", "three", "four", "five"))
 # Inward labels using negative length
p + annotate_axis_text(position = "bottom", x = c(2, 3, 4, 5),
tick_length = grid::unit(-15, "pt"))
# Inward labels using negative length
p + annotate_axis_text(position = "bottom", x = c(2, 3, 4, 5),
tick_length = grid::unit(-15, "pt"))
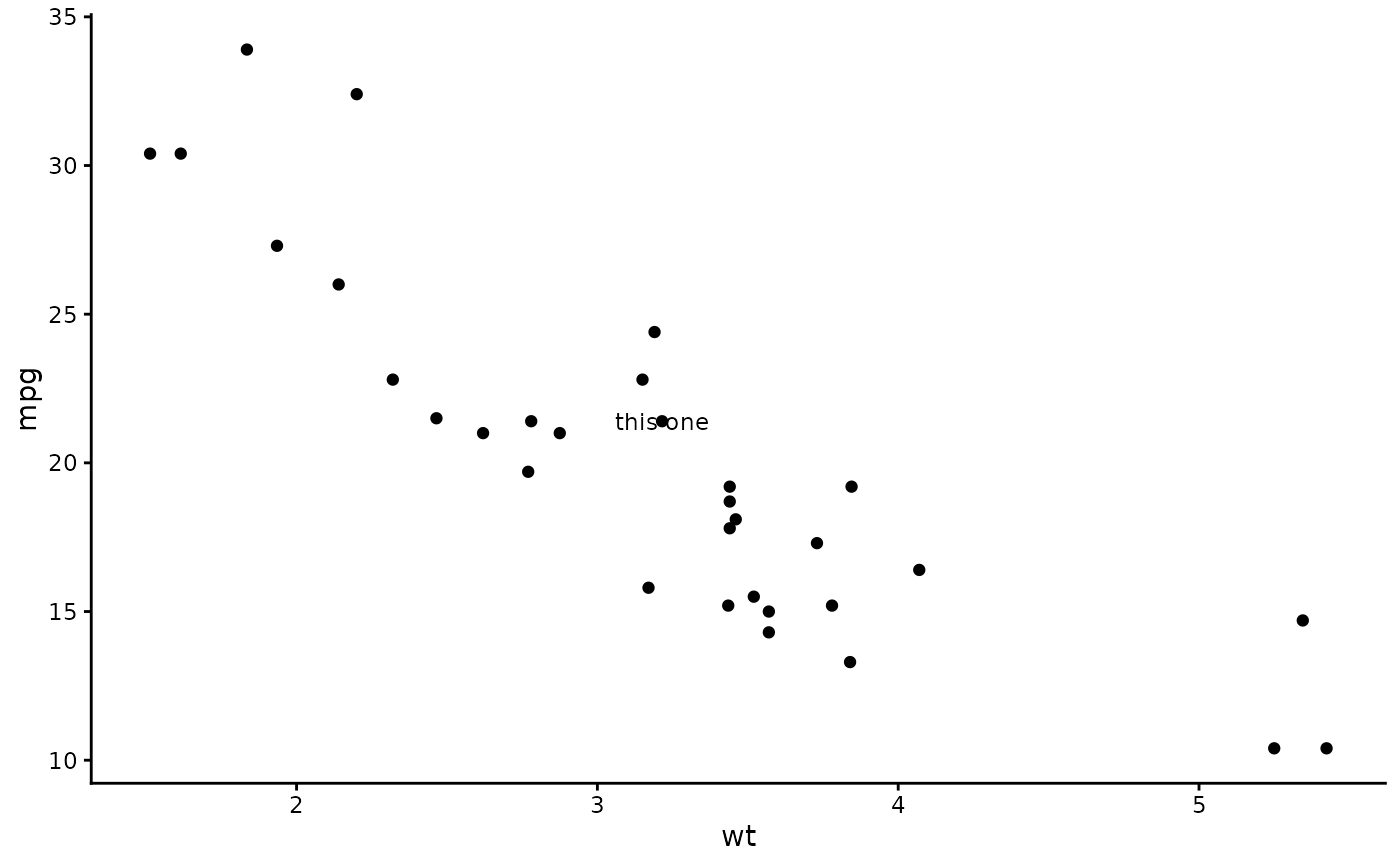
 # Arbitrary positioning — label a specific point on the plot
p + annotate_axis_text(x = 3.215, y = 21.4, label = "this one")
# Arbitrary positioning — label a specific point on the plot
p + annotate_axis_text(x = 3.215, y = 21.4, label = "this one")