Draws a line with style defaults taken from the axis.line element of the
set theme. Typically used to place a line along an axis edge or as an
interior reference line, with optional xmin/xmax/ymin/ymax to draw
a partial line. Lines along or outside the panel boundary requires
coord_cartesian(clip = "off").
Usage
annotate_axis_line(
  ...,
  position = NULL,
  x = NULL,
  y = NULL,
  xmin = NULL,
  xmax = NULL,
  ymin = NULL,
  ymax = NULL,
  xend = NULL,
  yend = NULL,
  curvature = NULL,
  angle = 90,
  ncp = 5,
  colour = NULL,
  linewidth = NULL,
  linetype = NULL,
  element_to = "keep"
)
Arguments
- ...
Not used. Allows trailing commas and named-argument style calls.
- position
One of
"top","bottom","left", or"right". Axis line mode only.- x
In axis line mode, a single x value for a vertical line. In segment/curve mode, the x start position. Use
I()for normalized coordinates (0-1).- y
In axis line mode, a single y value for a horizontal line. In segment/curve mode, the y start position. Use
I()for normalized coordinates (0-1).- xmin, xmax
Start and end x positions for a horizontal axis line. Use
I()for normalized coordinates (0-1). Axis line mode only.- ymin, ymax
Start and end y positions for a vertical axis line. Use
I()for normalized coordinates (0-1). Axis line mode only.- xend, yend
End position of the segment or curve. Providing all of
x,y,xend,yendtriggers segment/curve mode.- curvature
Amount of curvature. Negative curves left, positive curves right, zero is straight.
NULL(default) draws a straight segment.- angle
Skew angle of curve control points (0-180). Used only when
curvatureis non-NULL. Defaults to90.- ncp
Number of curve control points. Higher values give smoother curves. Used only when
curvatureis non-NULL. Defaults to5.- colour
Inherits from
axis.linein the set theme.- linewidth
Inherits from
axis.linein the set theme. Supportsrel().- linetype
Inherits from
axis.linein the set theme.- element_to
One of
"keep","transparent", or"blank". Controls whether the native theme axis line is suppressed. Defaults to"keep". Axis line mode only.
Details
Can also draw a straight segment or curve between two arbitrary points when
x, y, xend, and yend are all provided.
Examples
library(ggplot2)
set_theme(theme_classic())
p <- ggplot(mtcars, aes(wt, mpg)) +
geom_point() +
coord_cartesian(clip = "off")
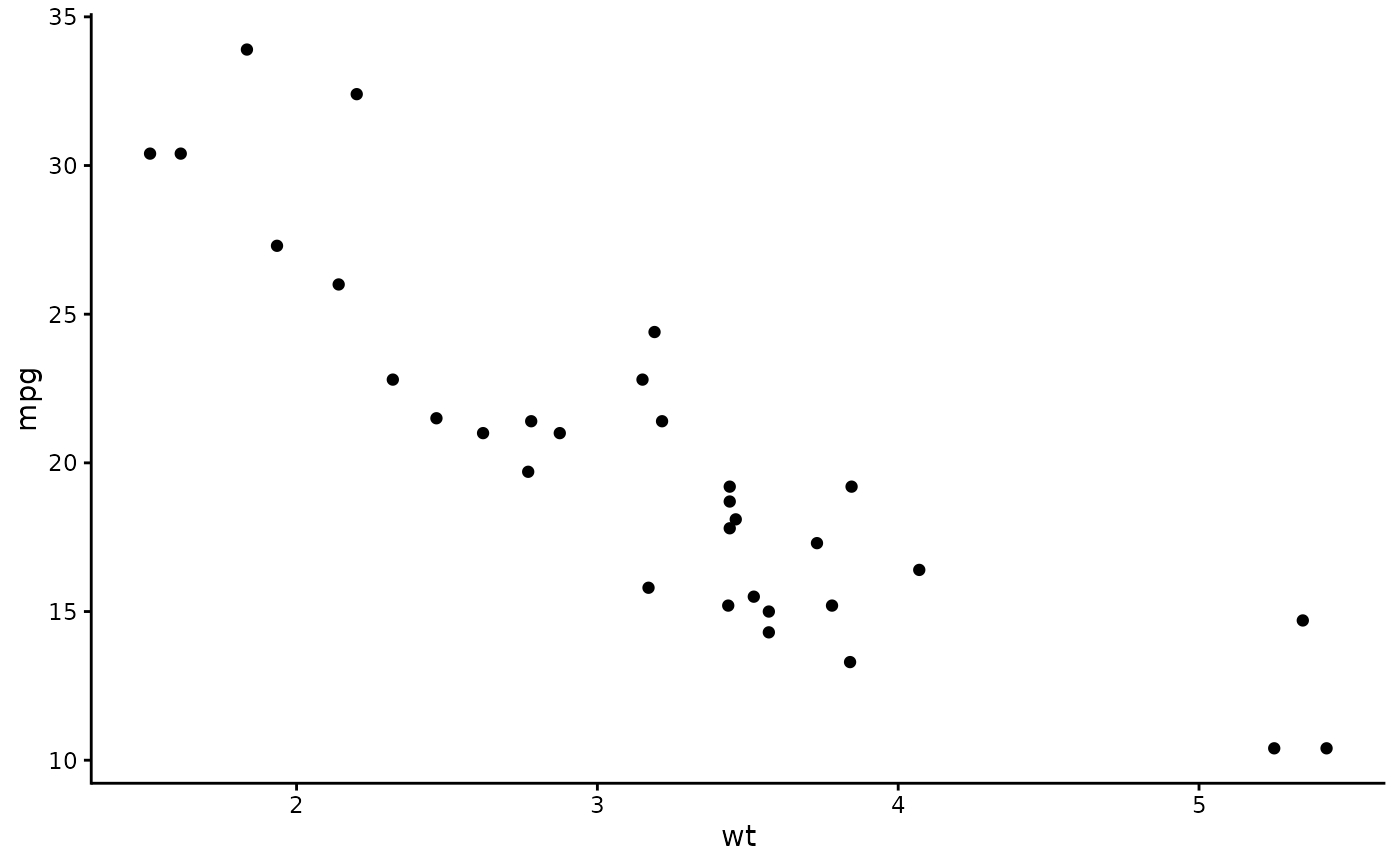
# Replace the bottom axis line
p + annotate_axis_line(position = "bottom", element_to = "transparent")
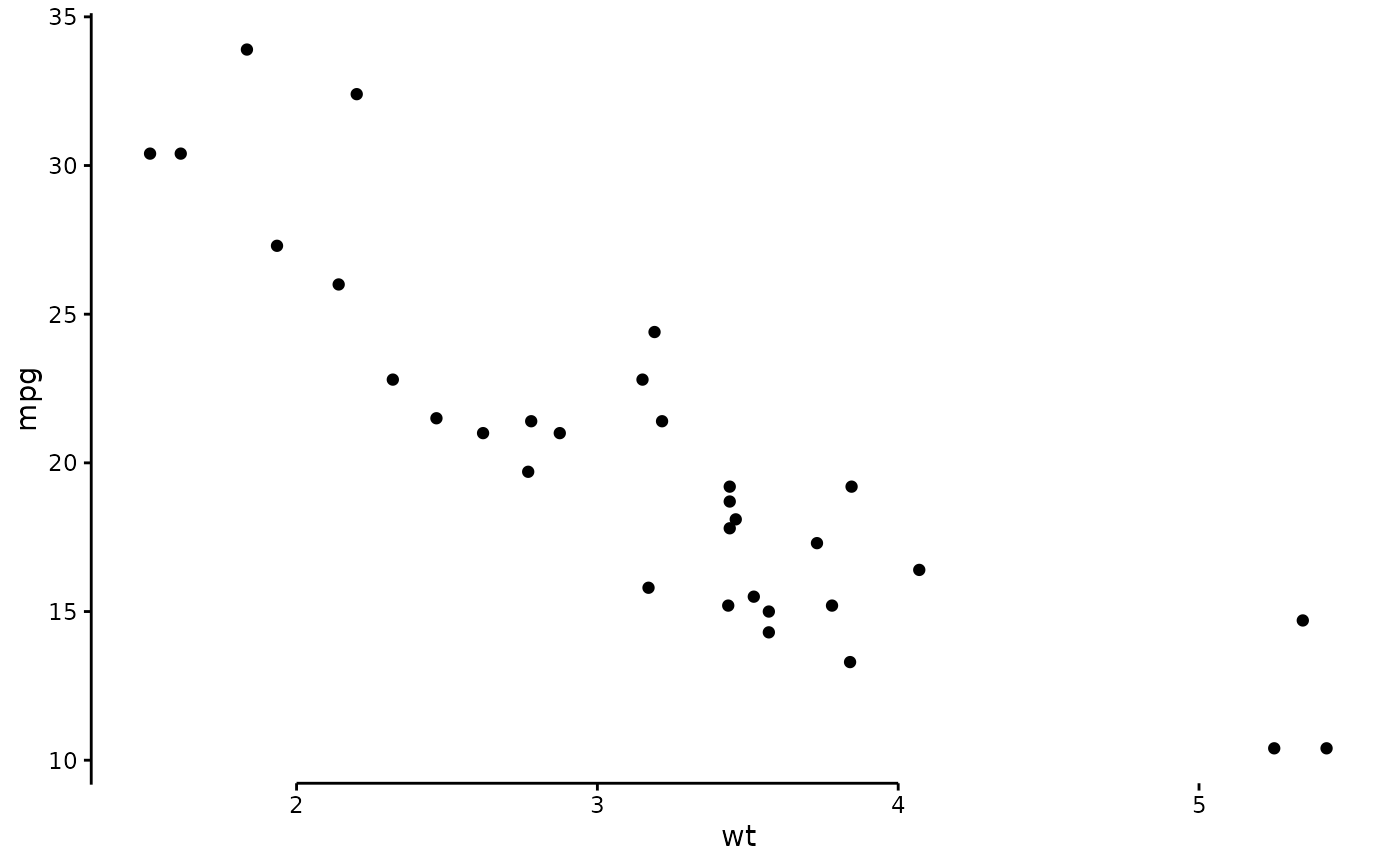
 # Partial bottom axis between x = 2 and x = 4
p + annotate_axis_line(position = "bottom", xmin = 2, xmax = 4, element_to = "transparent")
# Partial bottom axis between x = 2 and x = 4
p + annotate_axis_line(position = "bottom", xmin = 2, xmax = 4, element_to = "transparent")
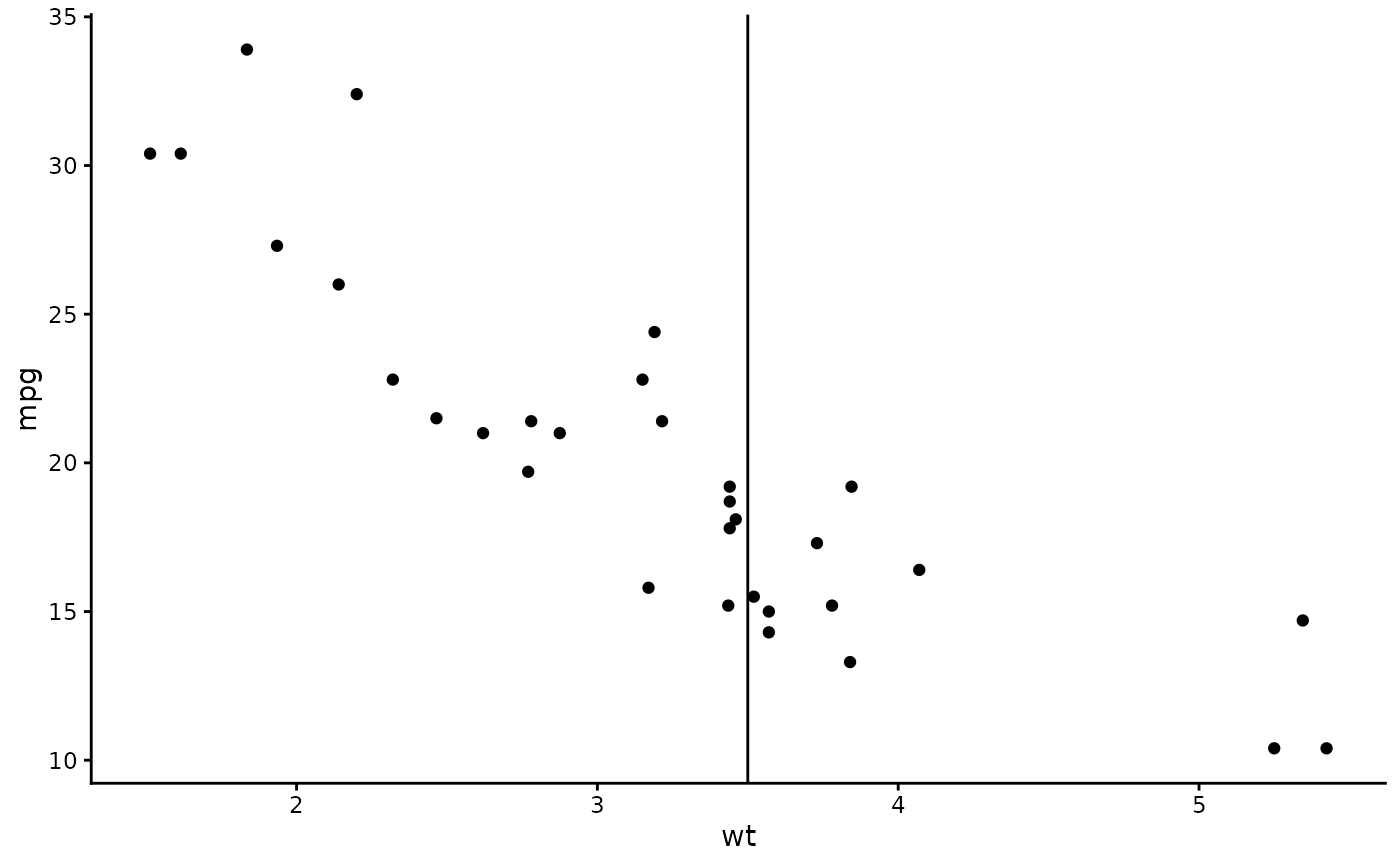
 # Vertical rule at x = 3.5
p + annotate_axis_line(x = 3.5)
# Vertical rule at x = 3.5
p + annotate_axis_line(x = 3.5)
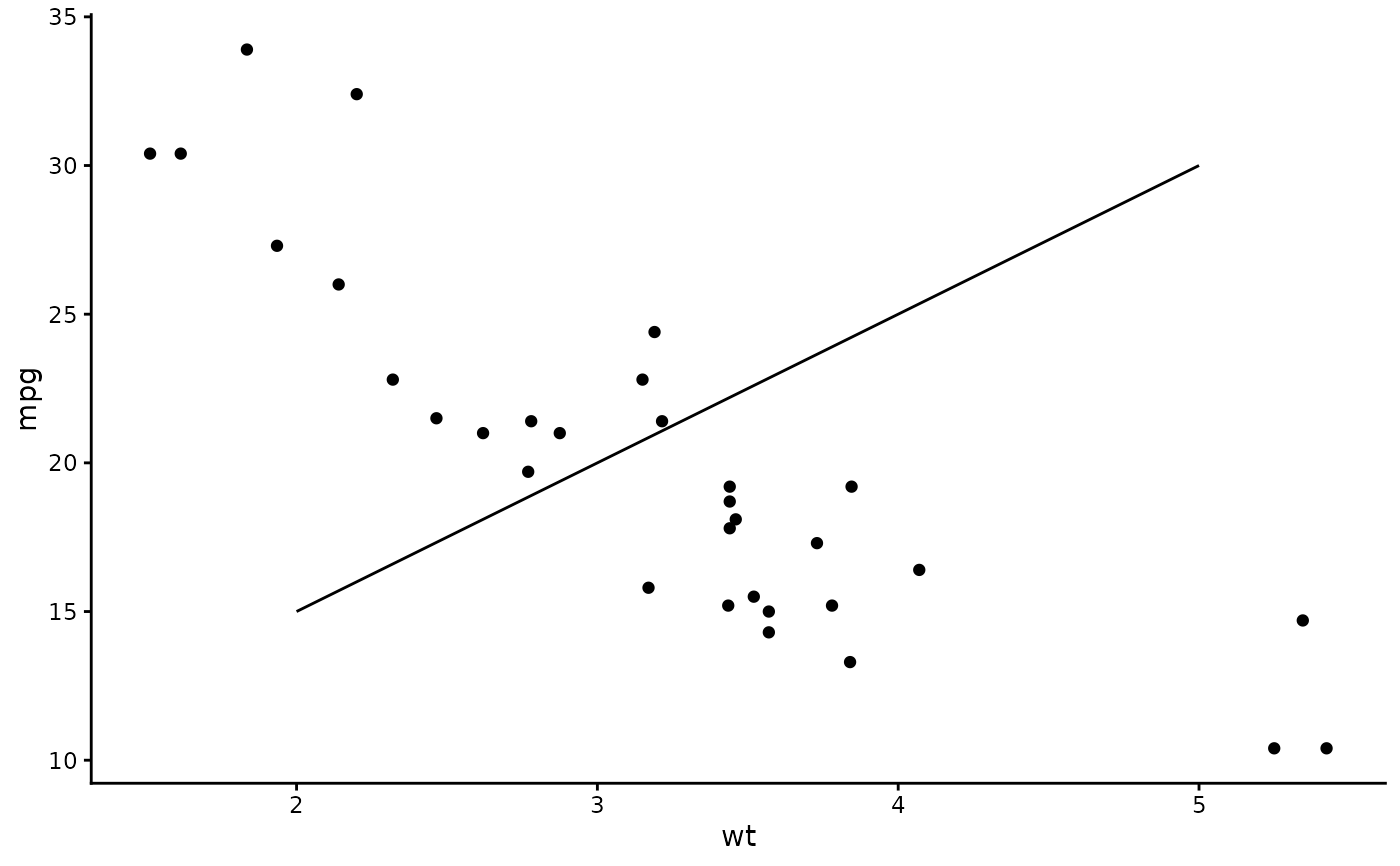
 # Straight line between two data points
p + annotate_axis_line(x = 2, y = 15, xend = 5, yend = 30)
# Straight line between two data points
p + annotate_axis_line(x = 2, y = 15, xend = 5, yend = 30)
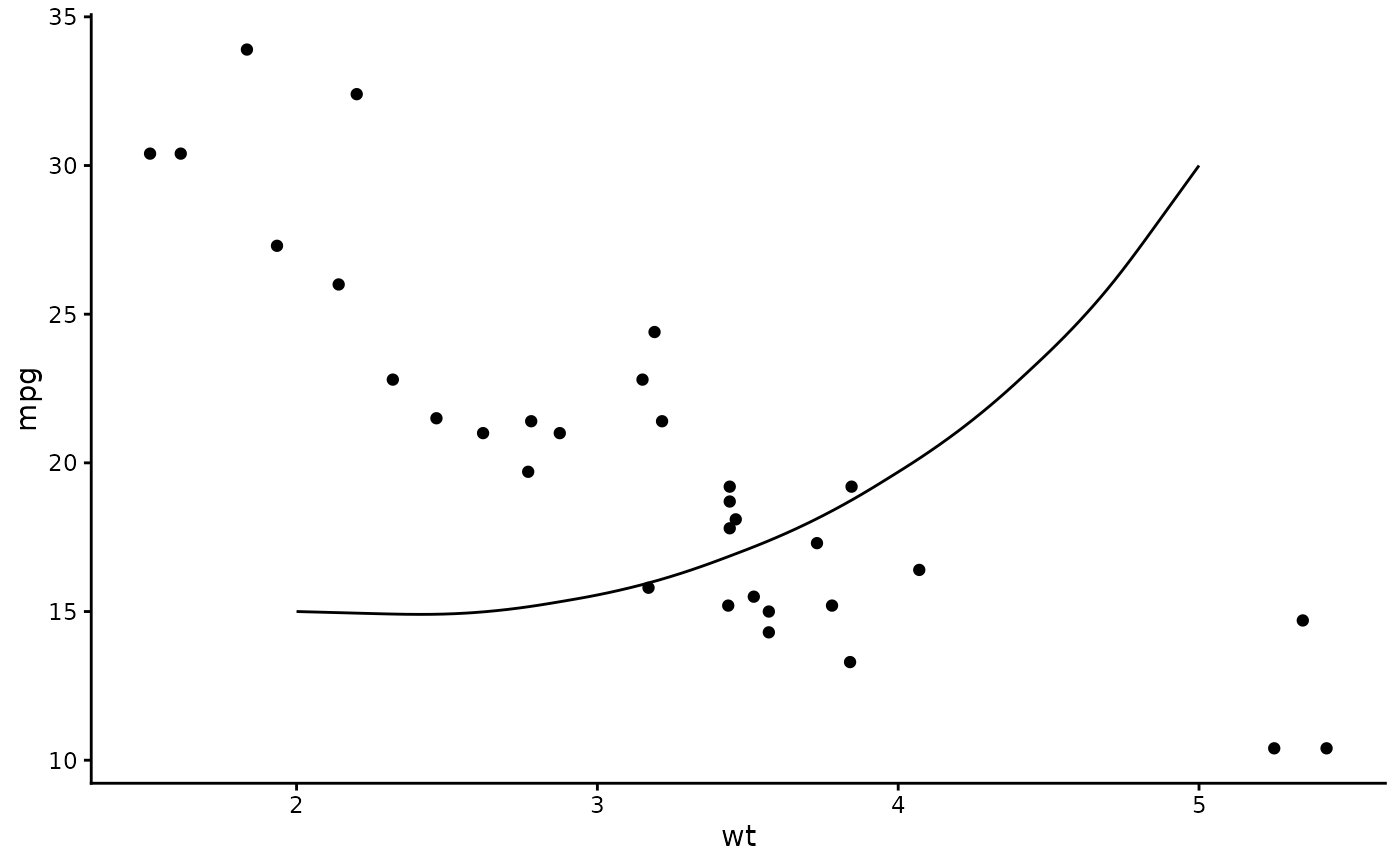
 # Curved line between two data points
p + annotate_axis_line(x = 2, y = 15, xend = 5, yend = 30, curvature = 0.3)
# Curved line between two data points
p + annotate_axis_line(x = 2, y = 15, xend = 5, yend = 30, curvature = 0.3)